Past performance is no guarantee of future results
In my meetings with advisors this quarter, I am focusing on a phrase that is common in our industry. It's sufficiently succinct and simple to be understood by those who aren't veterans of our industry. We recite it to clients, we read it in marketing literature and prospectuses, we see it on TV spots. It can, at times, wash over us. But it contains a lot of wisdom if you stop and think about its meaning. What's the phrase?
"Past performance is no guarantee of future results."
Why am I having conversations with advisors around this phrase that's typically viewed as the purview of the compliance department? It's because I believe that this phrase can help advisors and their clients in today's market environment, especially as advisors begin to have their 2018 review and 2019 planning meetings with their clients.
"Past performance is no guarantee of future results" is generally treated as a warning label: Don't assume an investment will continue to do well in the future simply because it's done well in the past. "Past performance is no guarantee of future results."
But, the phrase contains a second meaning, too: A potential investment opportunities label: Don't discount an investment simply because it's done poorly recently--it could improve. "Past performance is no guarantee of future results."
What might the phrase be trying to warn us against or lead us toward in today's market environment? In our view at Russell Investments, it's warning against overloading on U.S. equities and selling our non-U.S. equity positions. By now, everyone has heard the case and seen the numbers:
- To say that the trailing 10-year stock market return for U.S. equities has been anything less than extraordinary would be an understatement. U.S. stocks--in particularly large cap growth stocks--have beaten every major asset class in every standard time period as of September 30, 2018. This makes selling multi-asset model portfolios more heavily tilted toward U.S. equities easy to continue selling to clients. Investors don't tend to object to investing in an opportunity that has been shining recently.
- But, this strong run comes at a price: No matter your metric, valuations in the U.S. appear stretched relative to other regions and, importantly, they are also stretched relative to their own history.
- Historically this sort of situation has harbored material downside risk for investors.
- So, what are the alternatives? In our view: International developed and emerging market equities. Their valuations appear more attractive and their fundamentals are strengthening. And yet, there's a disconnect when it comes to how investors allocate their portfolios to these regions. Consider the breakdown of market capitalization as represented by global indices compared to how investors are actually allocated based on assets that are held in U.S. open end mutual funds and ETFs:
- International developed equities represent 34% of market capitalization, according to MSCI1, but Morningstar mutual fund universes indicate that international developed accounts for only 17.7%2 of all U.S and non-U.S. equity mutual fund assets.
- Emerging markets represent 11% of market capitalization3. Yet, only 4.8%4 of assets are invested in emerging markets funds.
- Contrast that with U.S. stock market capitalization--only 55% of the global opportunity set5, yet our home market mutual fund/ETFs represent 77.5%6 of total assets across global equities.
There are many reasons why U.S. investors tend to under-allocate to international and emerging markets relative to their market cap opportunity set. But, those reasons are likely compounded today. Why is that? Because it's hard to buy low and sell high--and buying low is exactly what investors in international and emerging markets are having to do. It's hard to accomplish because:
- There's the intellectual challenge of identifying winners early--that arguably requires knowledge, insight, creativity, vision, experience;
- But the bigger challenge is behavioral: Having the courage--and inspiring clients to have the courage--to act, to be contrarian and invest in something others don't see value in (that's why the price is low, after all) and then to be patient.
Drumming up excitement among clients about an investment that is doing well and whose near-term performance is impressive requires less effort overall. Getting clients enthused about an investment that has hurt portfolios recently but that you believe is likely to turn around despite current uncertainty, requires much more time, conviction and trust.
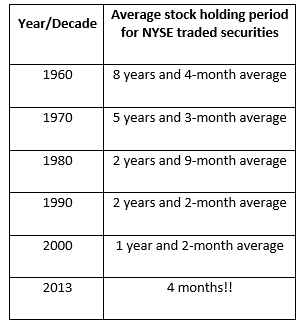
It's all the more challenging in today's 24/7/365 news cycle that eats "patience is a virtue" for breakfast. Seeing a multi-asset portfolio through a full market cycle seems like a quaint notion to many investors today. Some investors may tell their advisors that they're invested for the long term, yet they look at their account values what seems like every day online. These numbers below are quite shocking, but at the same time aren't really that shocking at all. The average holding period of individual stocks on the NYSE reflects in the general shift in time horizon that many investors have adopted7:
Unfortunately, we all know that more information rarely leads to better decisions or outcomes for investors. Rather, it tends to breed impatience. We all know that clients rarely called thanking you for their emerging market and developed international exposures during calendar year 2017 when they led the way at +37% and +25%, respectively8. But, they sure ask about changing strategies or point out when international and emerging market performance is red on their statements in other years, like 2018.
One tangible way to consider changing the discussion with clients as you head into the 2019 business planning season, is to look at your client's portfolio allocation. Is the strategic allocation today still fit where that client is in their stage of life? For instance, is your original 60/40 balanced portfolio still reflective of a 60/40 risk tolerance? Are clients filling out the investor profiles differently today than they were in 2008? Is the 60/40 risk tolerance of 2008 the new 80/20 risk tolerance today? Remember, investment markets have been quite extraordinary over the last 10 years … and, your client is 10 years older as well.
It's important to beware because if you started a client portfolio 10 years ago and it wasn't re-balanced, it could look like this today as illustrated in the chart and table below:
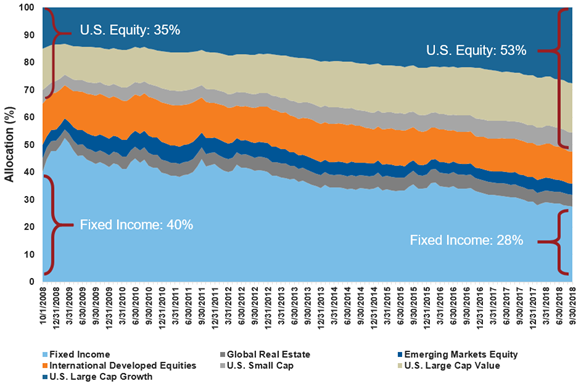
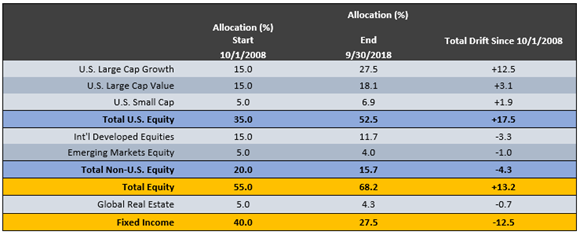
Note: Hypothetical analysis provided in the chart & table above for illustrative purposes only. Source for both chart & table: U.S. Large Cap Growth: Russell 1000 Growth; U.S. Large Cap Value: Russell 1000 Value; U.S. Small Cap: Russell 2000; International Developed: MSCI World ex USA; Emerging Markets Equity: MSCI EM; Global Real Estate: FTSE EPRA NAREIT Developed: Fixed Income: Bloomberg U.S. Aggregate Bond.
It turns out, a 60% equity / 40% hypothetical balanced index portfolio in 2008 would now be a 72.5% / 27.5% portfolio. Most of that equity 13.2 percentage point equity drift occurred in U.S. equities--a 17.5 percentage point allocation increase! Forensic analysis of that U.S. equity drift reveals that the majority of that drift benefited U.S. large cap growth assets.
This type of material drift has implications for the portfolio's risk profile--generally felt most acutely by clients during periods of uncertainty and volatility (remember the fourth quarter of 2018?) than during periods of market calm. When markets are rocketing up, many investors believe they have a high tolerance for risk. When market volatility reappears, however, tolerance instantly evaporates and turns into dread for many investors.
A chart like the one above can help clients visualize that markets today are not what they were 10 years ago. Portfolios and investor psychology need to adapt.
The bottom line
Helping clients appreciate the full meaning of "Past performance is no guarantee of future results" can be a lonelier, less trodden path than the approach that focuses on the latest winning investment. If the less common, more challenging path is the direction you as an advisor are headed--and it's the direction you are guiding your clients--rest assured, you won't be alone. Russell Investments will be on that same road with you. After all, our job is to allocate multi-asset portfolios for the next 10 years, not the last 10 years. Wayne Gretzky once said, "I skate to where the puck is going to be, not to where it has been." To us, that means investing in non-U.S. developed and emerging market equities in today's markets.
1 As of September 30, 2018. Based on MSCI World ex U.S. IMI Index market capitalization as a percentage of MSCI ACWI IMI and MSCI Frontier Markets IMI Indexes.
2 As of September 30, 2018. Represented by Morningstar US Fund Foreign Large Blend, Foreign Large Growth, Foreign Large Value, Foreign Small/Mid Blend, Foreign Small/Mid Growth and Foreign Small/Mid Value categories
3 As of September 30, 2018. Based on MSCI Emerging Markets IMI Index as a percentage of MSCI ACWI IMI and MSCI Frontier Markets IMI Indexes.
4 As of September 30, 2018. Represented by Morningstar US Fund Diversified Emerging Markets category
5 As of September 30, 2018. Based on MSCI USA IMI Index market capitalization as a percentage of MSCI ACWI IMI and MSCI Frontier Markets IMI Indexes.
6 As of September 30, 2018. Represented by Morningstar US Fund Large Blend, Large Growth, Large Value, Mid-Cap Blend, Mid-Cap Growth, Mid-Cap Value, Small Blend, Small Growth and Small Value categories
8 Source: Emerging Market Equity based on MSCI Emerging Markets Index and International Developed Equity based on MSCI EAFE Index for the calendar year 2017.