Foreign stocks aren't as foreign as you think
Have you ever done an inventory of the products that you use every day? I recently did this exercise and was shocked by the domicile of the parent companies. I start my day using a product that benefits a stock being traded in Japan and finish my day with a product that benefits a company in the UK.
Inventory of everyday products
|
|
|
|
|
|
|
|
Foreign stocks aren’t as foreign as you think
The word foreign throws many investors off. Non-U.S. developed market companies may be perceived to be unrecognizable names operating under different guidelines.
Samsung®, for example, is the fourth largest stock in the MSCI Emerging Markets Index by market cap as of August 2019. With over 20% global market share, Samsung has been the largest TV manufacturer since 2006.1 While there are many U.S. investors who appreciate Samsung as a leader in television electronics, they may not make the connection it’s an emerging market stock domiciled in South Korea.
Unilever, a British-Dutch company, has 27 recognizable brands in the U.S. I personally use many of them daily including: Dove® soap, Q-tips®, Noxzema® and Suave® shampoo.2 Some other recognizable Unilever brands include: Ben & Jerry’s, Klondike®, Hellmann’s mayonnaise, Lipton®, and Vaseline®.
Countries of origin and U.S. revenue stream
The reality is that markets are now global. Many of the stocks in non-U.S. developed markets are likely generating a significant amount of their revenue outside of their country of domicile. In fact, that revenue may well be coming from the U.S. For example,
- Swiss giant, Nestlé, derives 45% of its sales from the U.S.3 According to the MSCI EAFE Index, Nestlé is the largest company in the index by market cap. The company also happens to be the largest food company in the world as measured by revenues since 2014.4 Nestlé has 55% market share of the water market in the U.S.5 It’s not widely known that Nestlé owns Poland Spring®—and while the water comes from Maine, the revenue goes to Switzerland.
- Unilever generated 77% of its 2018 revenue from outside of the UK and Netherlands, of which 15% came from the U.S.6
As previously written, while investors may have reservations about allocating a portion of their investment portfolio to non-U.S. companies—they’re comfortable allocating a part of their daily consumption to the products those same companies make.
So why is it that we’ll buy food or beverage products when they are on sale at the supermarket, but when their stocks are on sale, we ignore them?
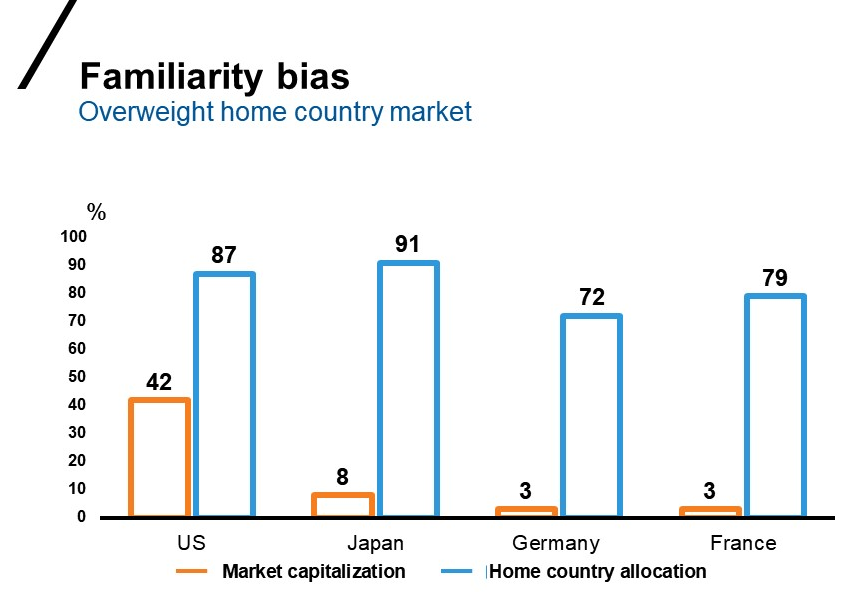
Home country bias
When I speak to individual investors about non-U.S. developed and emerging market stocks, I usually witness a scowl on their faces before I hear their thoughts on the topic. In fact, there is a term to describe an investor’s preference for stocks based in their own country:It’s called home country bias.
The chart below shows there is a tendency for investors, on average, to be overweight allocations to their home country relative to the country’s market capitalization.
Click image to enlarge
 Source: World GDP (2016, in current USD)—World Bank https://data.worldbank.org/indicator/NY.GDP.MKTP.CD?end=2016&start=1960&view=map Accessed on March 23, 2018. Market capitalization of domestic listed companies (2016, in current USD)---World Bank https://data.worldbank.org/indicator/CM.MKT.LCAP.CD?view=map Accessed on March 24, 2018. Home country equity allocation—John R. Nofsinger, The Psychology of Investing, Fifth Edition, Pearson, 2014, p. 89.
Our preference for U.S. equities has served us well over the last decade.After all, as of August 31, 2019, U.S. equities (Russell 3000 Index) have out-performed international developed stocks (MSCI EAFE Index) and emerging markets (MSCI Emerging Markets Index) for the past quarter to-date, 1-year, 3-year and 10-year periods.
Click image to enlarge
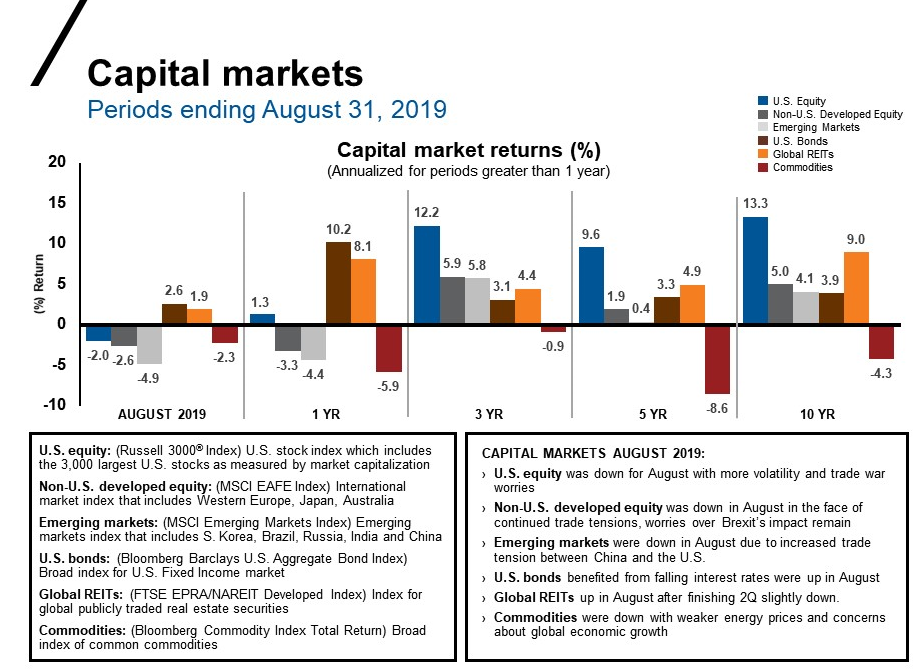
 Source: FTSE/Russell, Bloomberg, MSCI and FTSE NAREIT. Index returns represent past performance, are not a guarantee of future performance, and are not indicative of any specific investment.
Past performance, however, is no indication of future results and asset class leadership eventually changes.
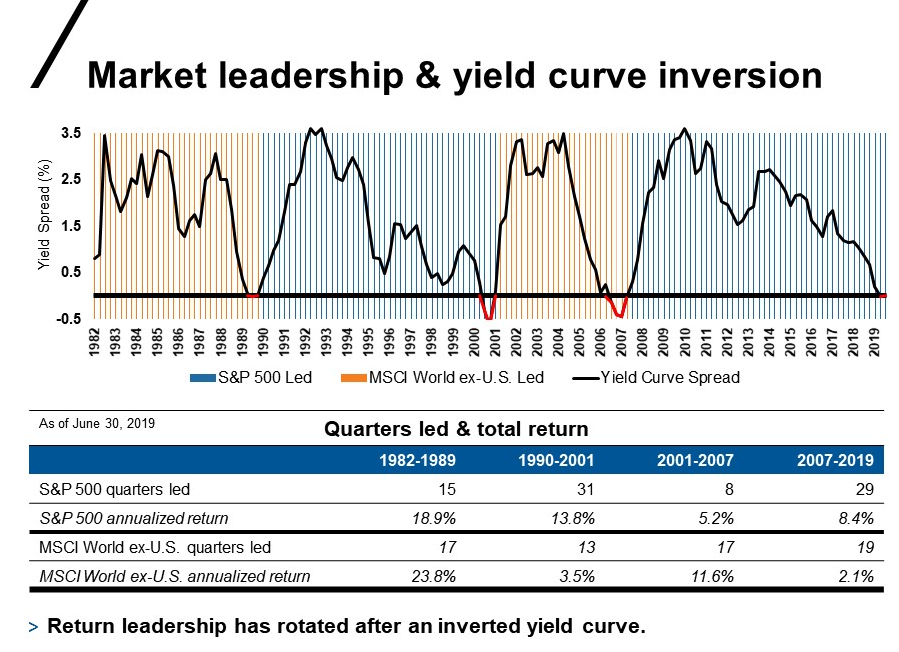
Market leadership rotates
Over the last two decades, U.S. and non-U.S. developed markets have traded places.As shown in the chart below from 2001-2007, non-U.S. developed market equities, as indicated by the MSCI World ex-US index, led the U.S. 11.6% vs. 5.2% for 17 quarters.
In 2007, U.S. markets took over and continue to lead through the second quarter of 2019.
Click image to enlarge
Morningstar Direct. FRED (Federal Reserve Economic Data). Index returns represent past performance, are not a guarantee of future performance, and are not indicative of any specific investment. See disclosures for ratio definitions.
The S&P 500 has led for 29 quarters, generating an 8.4% annualized return, vs. the MSCI World ex-U.S., which led for 19 quarters and only generated a 2.1% annualized return.
Cycles cannot be predicted and no cycle is the same, however, it can be said that U.S. markets are probably in the latter part of the cycle.
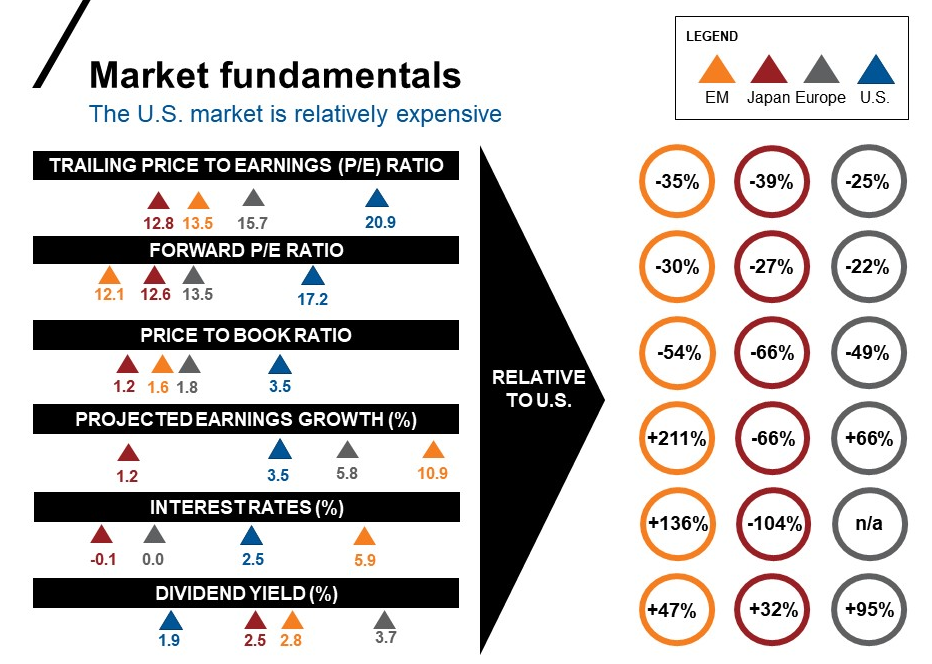
Valuations matter
We believe the price you pay for an asset is important.In order to have proper perspective on valuations, you can look at forward price-to-earnings (P/E) ratios and projected earnings growth.
If we were to compare emerging markets, Japan, Europe and the U.S., many investors in the U.S. might be surprised to see that emerging markets are trading at the lowest forward P/E (12.1x) with the highest projected earnings growth (10.9%) as shown in the chart below.
Click image to enlarge
Data as of June 2019. Source: MSCI Country and regional Indexes, Bloomberg country and regional indexes. Russell Investments calculations. Index returns represent past performance, are not a guarantee of future performance, and are not indicative of any specific investment. See disclosures for ratio definitions.
Stocks in Europe are trading at a forward P/E of (13.5x) with projected earnings growth of 5.8%.Compared to the U.S., emerging markets and Europe are trading at attractive levels on a forward looking basis.
Bottom line
U.S. investors are not immune to having home country bias.We have proof that the average U.S. investor has just shy of 90% of their assets in U.S. stocks.The U.S. equity markets are now in the eleventh year of a bull market, as measured by the S&P 500, and valuations are at the highest on a relative basis compared to the rest of the world.7
We believe now is an opportune time to help investors evaluate what they own and determine if their portfolios are positioned for what is to come as opposed to what has already happened.
If we only had access to one global stock exchange, we believe investor behavior would be much different.Investors would likely focus more on valuations and earnings growth and less on headline news and the country of origin.
The stocks of some of the largest brands and products internationally are currently on sale with stronger earnings growth than their U.S. counterparts. It is impossible to time when a market cycle is going to change, but we do know that asset prices matter.We believe now is the time to seriously consider diversifying portfolios by increasing allocation to non-U.S. stocks.
Remember, foreign stocks aren’t as foreign as you think.
1 Global HD TV Market Report 2018-2022
2 https://www.unilever.com/brands/?Country=408018&page=2
4,5 Statistica: https://www.statista.com/statistics/268894/food-sales-of-the-nestle-group-by-region/
6 Statistica: https://www.statista.com/statistics/269195/revenue-of-the-unilever-group-by-region/
7 Source: https://www.wsj.com/articles/what-yogi-berra-would-have-said-about-this-bull-market-11560524404
Related articles
Beyond borders: Why global diversification still matters, Part 1
Beyond borders: Why global diversification still matters, Part 2
Working on that 7-10 split: Keeping clients invested in international equities
Will 2019 be the year non-U.S. markets take the lead?
Past performance is no guarantee of future results
Here be monsters? U.S. economic expansion enters uncharted waters
Related podcasts:
Beyond borders: Why global diversification still matters