Working on that 7-10 split
If you’re even an occasional bowler, you know about the dreaded 7-10 split. According to the Pro Bowler’s Association, even the pros can only convert this to a spare 0.7% of the time. But if they want to win, they still try.
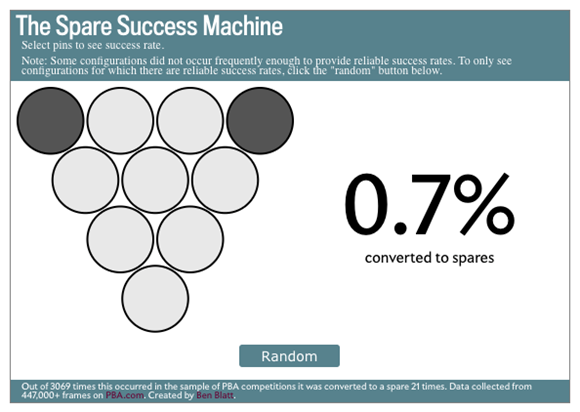
For advisors, it can feel just as hard to keep clients invested in international equities, after U.S. equities have done so well for so long. Connecting the logic between long-term performance and global diversification can feel just as far apart as those last two bowling pins.
Let’s look at some pendulum-swinging numbers to see why this matters when comparing international equities to U.S. equities:
- 1978-1987: International equities win 7 out of the 10 years
- 1988-1997: U.S. equities win 7 out of the 10 years
- 1998-2007: International equities win 7 out of the 10 years
- 2008-2017: U.S. equities win 7 out of the 10 years
Note: International = MSCI EAFE Index. U.S. = S&P 500 Index. Index returns represent past performance, are not a guarantee of future performance, and are not indicative of any specific investment. Indexes are unmanaged and cannot be invested in directly.
Those 40 years of history, broken into ten-year chunks, shows how the favorability of U.S. and international equities rotates over time, exhibiting a 7-10 split here as well. Of course, looking at it this way, an advisor might assume there’s a neat-and-tidy ten-year predictability to it, but the timing of the switch between the two regions is more nuanced and oftentimes more surprising.
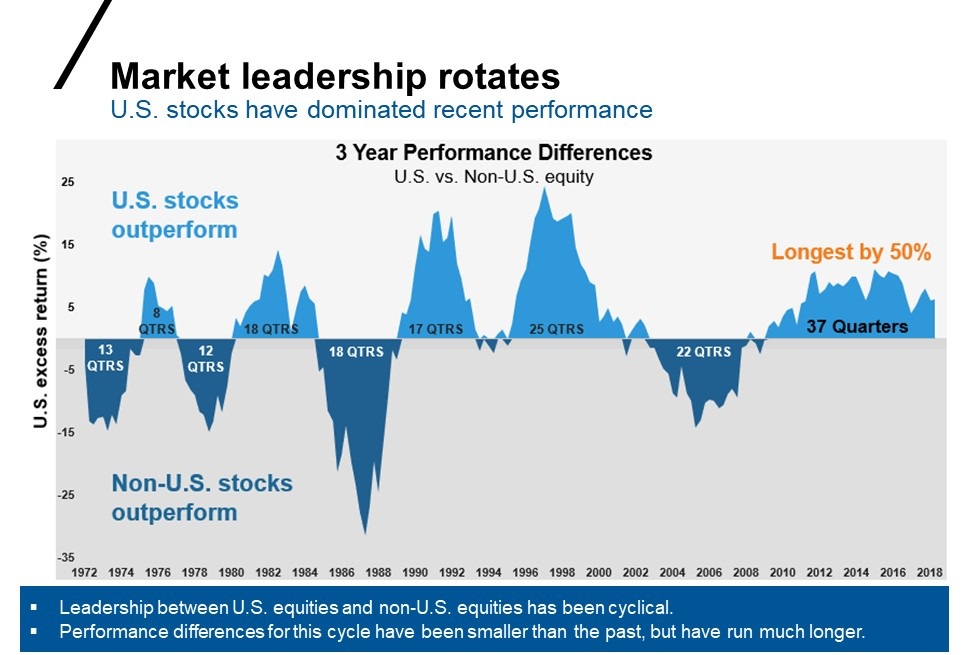
Source: Morningstar Direct; US Equities: S&P 500 Index, Non-US Equities: MSCI World ex USA.
Index returns represent past performance, are not a guarantee of future performance, and are not indicative of any specific investment. Indexes are unmanaged and cannot be invested in directly.
The length of the recent bull market for U.S. equities can be a dangerous threat to our collective investing memory banks. That’s why the cyclical numbers above are so important. Those numbers are proof that international equities can also outperform, and can do so for a significant period of time, just like U.S. equities have done during the last decade. Knowing this, we believe outcome-oriented advisors will recommend portfolios with as much as 40% of the equity exposure outside the U.S.
Why does this matter for investors?
Markets are cyclical. The asset class that outperforms one year might underperform the next. And the asset class that outperforms over a 10-year period might disappoint over the next decade. We call the chart below, Value of diversification. It shows how specific asset classes move in and out of style year-by-year. History has demonstrated that it is very difficult to predict which asset classes are going to lead and which ones are going to trail in any given year.
If you look at ten years ending 12/2008 (far left column below), you’ll see that U.S. Equity Large Cap sat on the bottom. A decade later, U.S. Equity Large Cap rose to the very top spot for ten years ending 12/2018 (second column on the right below). Commodities was second from the top for ten years ending 12/2008 but sank to the very bottom for 10 years ending 12/2018. We believe this cyclicality—which crosses all the asset classes in this chart—is the best argument for a diversified portfolio.
Click image to enlarge
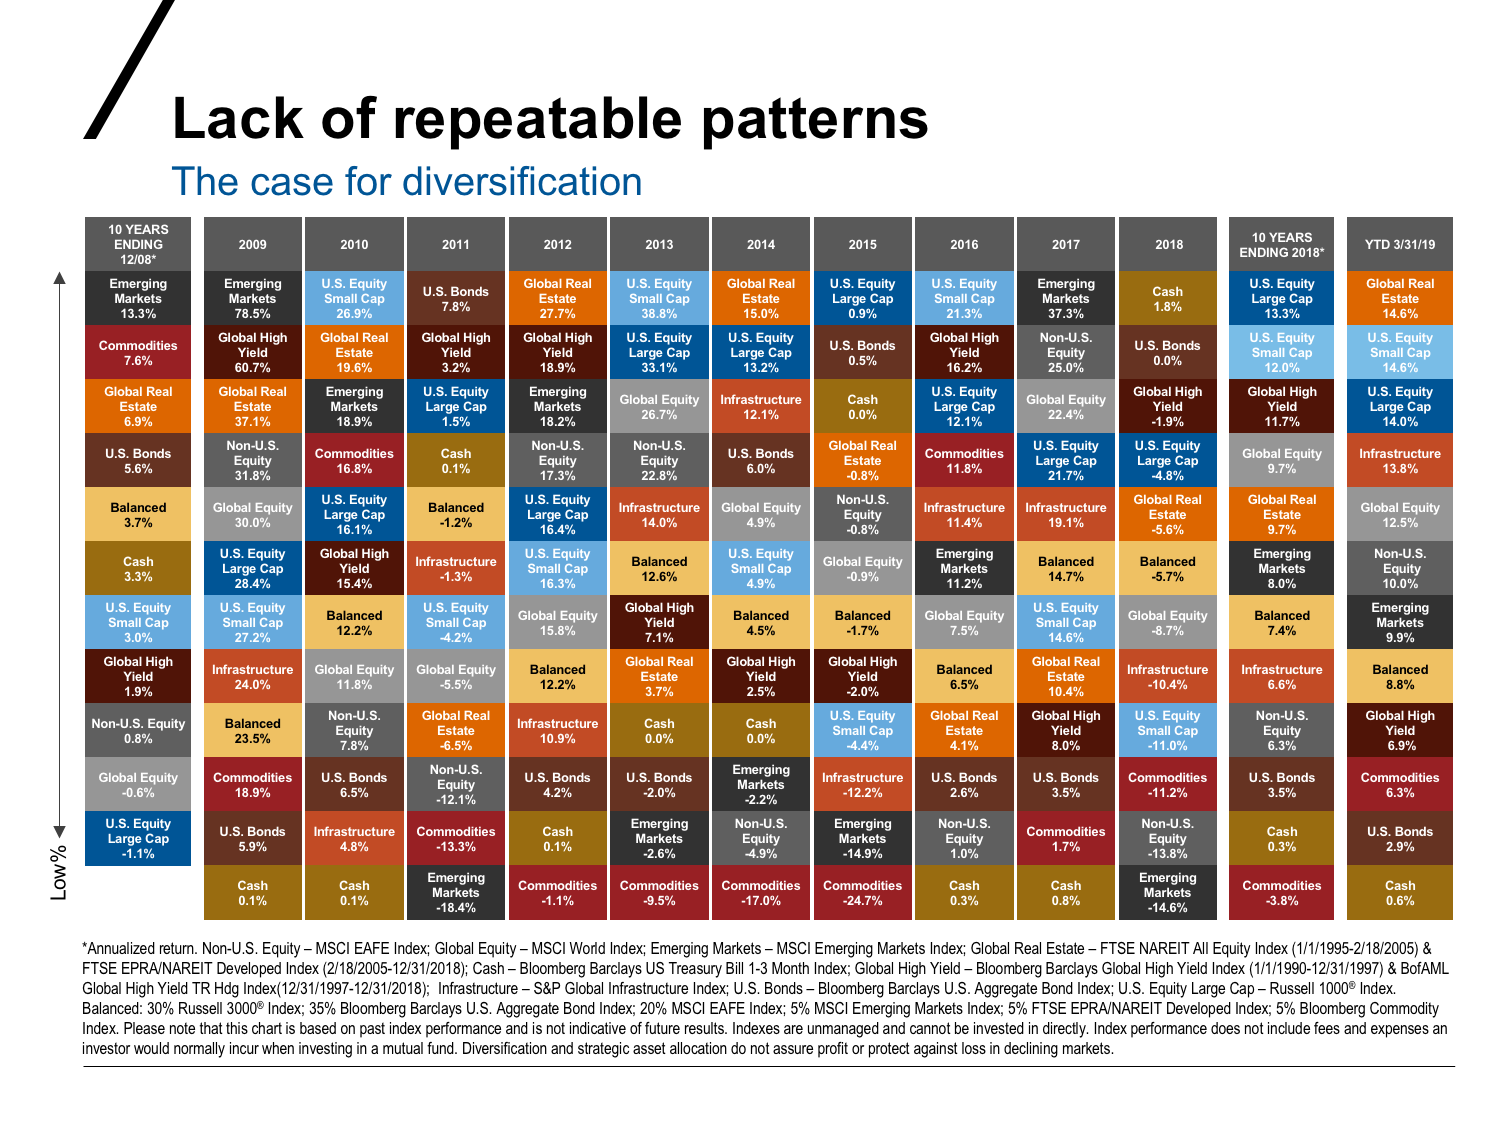
*Annualized return. Non-U.S. Equity – MSCI EAFE Index; Global Equity – MSCI World Index; Emerging Markets – MSCI Emerging Markets Index; Global Real Estate – FTSE NAREIT All Equity Index (1/1/1995-2/18/2005) & FTSE EPRA/NAREIT Developed Index (2/18/2005-12/31/2018); Cash – Bloomberg US Treasury Bill 1-3 Month Index; Global High Yield – Bloomberg Global High Yield Index (1/1/1990-12/31/1997) & BofAML Global High Yield TR Hdg Index(12/31/1997-12/31/2018); Infrastructure – S&P Global Infrastructure Index; U.S. Bonds – Bloomberg U.S. Aggregate Bond Index; U.S. Equity Large Cap – Russell 1000®Index. Balanced: 30% Russell 3000®Index; 35% Bloomberg U.S. Aggregate Bond Index; 20% MSCI EAFE Index; 5% MSCI Emerging Markets Index; 5% FTSE EPRA/NAREIT Developed Index; 5% Bloomberg Commodity Index. Please note that this chart is based on past index performance and is not indicative of future results. Indexes are unmanaged and cannot be invested in directly. Index performance does not include fees and expenses an investor would normally incur when investing in a mutual fund. Diversification and strategic asset allocation do not assure profit or protect against loss in declining markets.
What happens if investors don’t hold international equities?
Investors may continue to argue in favor of U.S. equities and against international exposure. We believe that’s a dangerous position and those investors could potentially miss out on a cycle shift that sees international markets outperform for a decade like they have in previous periods of time. Remaining undiversified could also increase the volatility in their accounts, if and when the U.S. experiences another bear market.
What’s the best way for investors to get there?
We think it’s vital that outcome-oriented investors work with a financial advisor to develop a strategy for global diversification. Should they abandon U.S. equities? Absolutely not. But we do believe it’s prudent to lean into international markets at this time. Our own current equity allocation strategies are approximately 55-60% in U.S. markets and 40-45% ex-U.S. international.
What about market timing
The key problem of trying to time the market is the potential cost of being wrong. Let’s say that you feel that being overexposed to international diversification means missing out on U.S. upside. We believe investors who are defensive (meaning diversified) too early are far better off than investors who are defensive too late. Investors should ask themselves: Am I confident enough that U.S. equities will continue to dominate that I’m willing to risk my life savings?
Is your portfolio built to succeed for the last ten years, or the next ten?
We believe focusing on past performance is a dangerous way to build financial security. We’ve all heard the compliance-friendly saying: Past performance is no guarantee of future results. That is the truth. Take another look at the value of diversification quilt chart above and you’ll see just how true that is. What did well last year may not do well next year.
The bottom line
When it comes to bowling, picking up that 7-10 split and turning it into a spare—well, those are odds we wouldn’t ever want to count on. When it comes to investing, there are no guarantees. But we can learn from the 7-10 international - U.S. split we’ve witnessed over time. At Russell Investments, we believe diversification—including allocations to international equities—is the best strategy for putting the odds in your favor.