The magic of storytelling for your business
Albert Einstein once said, "If you can’t explain something simply, you don’t understand it well enough." I can't agree more—especially when it comes to growing and protecting people's nest egg. Unfortunately, in my 20 years in the investment industry, I've often sensed that I'm in the minority on this issue: Our industry seems to love making the simple sound so complex that many clients think we are speaking a foreign language.
That's a problem because it breeds mistrust. In my experience, clear, relevant and relatable stories are what draw people in and can cement the foundations of long-lasting relationships. Maybe I'm biased—I've been a story teller since childhood, just ask my parents – but here are three stories I've been sharing with advisers to help them connect with clients concerned about various aspects of the current market environment.
Story #1: "Which lane is best?"
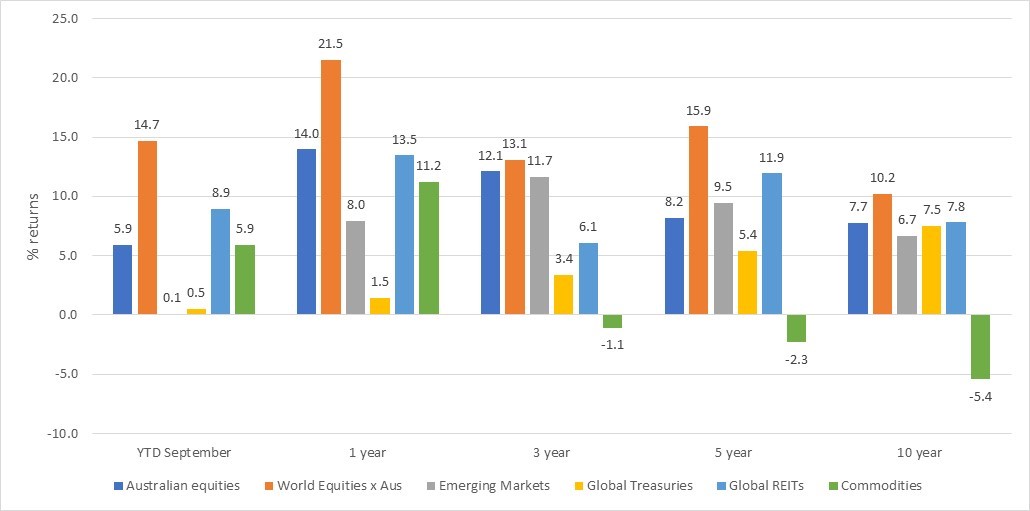
Source: FTSE/Russell, S&P, Bloomberg , MSCI and FTSE NAREIT. Index returns represent past performance, are not a guarantee of future performance, and are not indicative of any specific investment.
To a novice client, a capital market returns chart like the one above just looks like a bunch of lines and numbers that doesn't, at first glance, answer the critical question, "So what does this mean for me and my nest egg?"
That's why, when I talk about this chart with clients, I actually talk about highways. Yup, highways—specifically, highways that tend to suffer from a lot of congestion. For instance, No matter the time of day or weather, at some point you may have experienced sitting on a highway where the traffic is backed up on a slow crawl towards the exit and reaching it seems like it is never going to happen. As you approach the exit, the left-most lane miraculously begins to move a little faster. But that doesn't last, because everyone is lured into the promise of the faster lane and tries to move into it, causing it to back up. The insightful lane-switching drivers' lesson is that if they had exercised patience and discipline, and avoided the temptation to move out of their original lane, they would have experienced less aggravation and enjoyed a safer ride.
How does this relate to our capital markets chart? Asset class returns tend to be like traffic on a highway. In the world of capital markets, global - especially US - equities, have been the left lane—they've been moving faster than the other asset class lanes. Many investors are tempted to move to the left to take advantage of the momentum in U.S. equities. The highway analogy can help explain in a much more relatable way than historical returns and theories of reversion to the mean why such portfolio shifts may not deliver the better experience or the safer ride to investors. Having the patience to stay the course and arrive at the destination in one piece with less aggravation is the point of diversification.
Story #2: "Would you drive a car without brakes?"
How many times this week (let alone this month and year!) have you been asked by a client, "Why do I need bonds in my portfolio? Interest rates are going up and I'm afraid I won't make any money in bonds."
If you're like me, you've gotten that question at least half a dozen times in any given week lately. Here's the chart and the analogy I use to help address it:
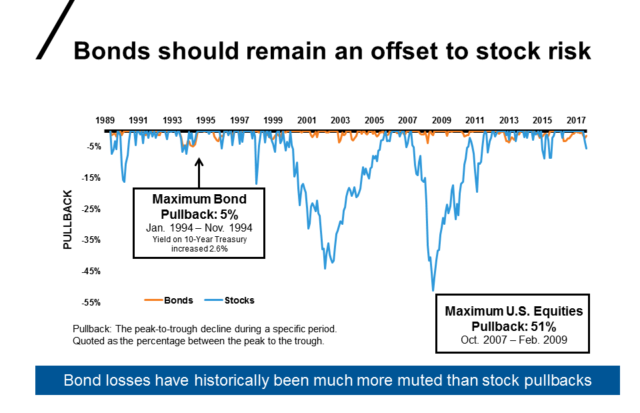
Source: Morningstar monthly max drawdown % for the Bloomberg U.S. Aggregate Bond Index ("Bonds") & the Russell 3000® Index ("Stocks") from 12/31/1989 to 3/31/2018. Indexes are unmanaged and cannot be invested in directly. Index returns represent past performance, are not a guarantee of future performance, and are not indicative of any specific investment. Diversification and strategic asset allocation do not assure profit or protect against loss in declining markets.
If investors are tempted to add more equity at the expense of fixed income to their overall portfolio, it may help to remind them that one of the primary roles of fixed income is to offset equity volatility. Not having bonds is akin to driving a car that only has an accelerator pedal. Such a car would be fine—and even lots of fun—when nobody else is on the road, the road is smooth, the weather is good, and you know where you are going. But let's be honest: that rarely happens in real life. Most of the time we are stuck in the traffic on the highway creeping towards the exit.
How do you bring this back to your client's portfolio? Equities typically act as the accelerator in a portfolio and bonds serve as the brakes. The airbags are like your alternative strategies. In the same way that no one would ever drive a car with only an accelerator, why would you have a portfolio with only stocks?
The biggest risk to a client's return is their own behaviour. As their trusted adviser, you can help guide clients toward an investment vehicle that is prepared for all scenarios—not just the dreamiest one.
Story #3: "Today's U.S. equity market may be like a jam doughnut."
Do any of your clients press you to add more U.S. stock exposure to their portfolio and reduce their domestic or non-US global shares exposure? Here's the analogy that might help them help them appreciate the potential benefits of diversification—without using any investment lingo. It may resonate most with clients who have a sweet tooth.
Let's pretend you're a doctor and a 75-year-old obese patient comes in and you discover that his main diet is jam doughnuts. Would you say, "Congrats on your great health!" or would you be the professional who advises, "You're lucky to have survived this long on that diet. You need to add some vegetables to your dietary portfolio. Veggies may not taste as appealing or look as tempting, but they will give you a better chance at a longer, healthier life."
In our view at Russell Investments, the U.S. equity market (highlighted in the center of the chart below) currently appears to be the jam doughnut in many investment portfolios. Investments in developed and emerging markets would be your vegetables. The chart offers a slight twist on the classic quilt chart of asset class performance and illustrates the returns of various asset classes relative to the U.S. equity market. So, any asset class that appears above U.S. equity outperformed for that calendar year, while any asset class that appears below U.S. equity underperformed for that calendar. Are you your client's doctor who can help them toward better health or their friend who tells them what they want to hear? The chart also helps remind clients that it wasn't that long ago when U.S. equity was not a very popular place to invest.
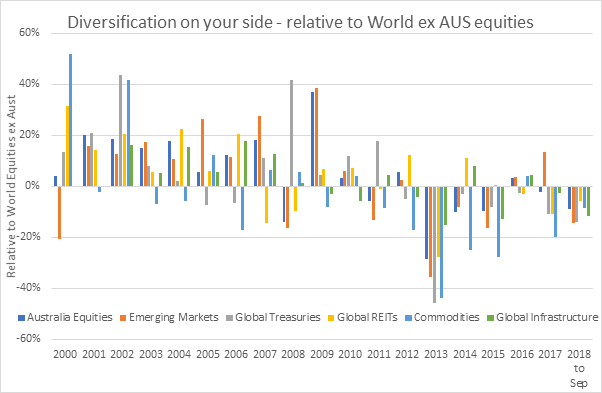
Source: Australian equities— S&P/ASX Russell 200 Index; World Equities ex Australia —MSCI World ex Australia Index; Emerging Markets: MSCI Emerging Markets; Global Treasury Bonds—Bloomberg Global Treasury Index AUD Hedged; Global real estate—FTSE EPRA/NAREIT Developed Index AUD Hedged; Commodities—Bloomberg Commodity Index; Global infrastructure—S&P Global Infrastructure Index. Index returns represent past performance, are not a guarantee of future performance, and are not indicative of any specific investment. Indexes are unmanaged and cannot be invested in directly.
The bottom line
These stores are simple, visual, and easy to understand for a reason. Clients don't want to know what you know as much as they want to know that you care. Communicating with them in a way that feels relevant and understandable will demonstrate your caring. So, go and develop your analogies. Tell your stories!