Could the tech bubble burst again? How today's market stacks up against the 90s
From 1994 to early 2000, technology and telecommunication stocks grew in euphoria with the prospects of the quickly developing internet. People poured money into the stock market to reap the gains, but when the tech bubble burst in 2000, not everyone was able to survive the collapse. Over the past 19 years, technology and communication services sectors have again seen new potential in the form of areas like mobile technologies, cloud technologies, artificial intelligence and social networks.
While this current tech frenzy reminds many of the dot-com bubble, there are some contrasts as well. Let’s go under the hood and take a closer look at both the similarities and differences.
ICMILO vs. FAAMA
In the late 1990s, six of the largest 10 firms in terms of capitalization were in technology or telecommunications: Intel, Cisco, Microsoft, IBM, Lucent, and Oracle (ICMILO). Today, five of the largest 10 firms by capitalization are in technology or communications: Facebook, Apple, Amazon, Microsoft, and Alphabet (FAAMA). It’s interesting to note that Microsoft is the only company that was in the top 10 during both periods.
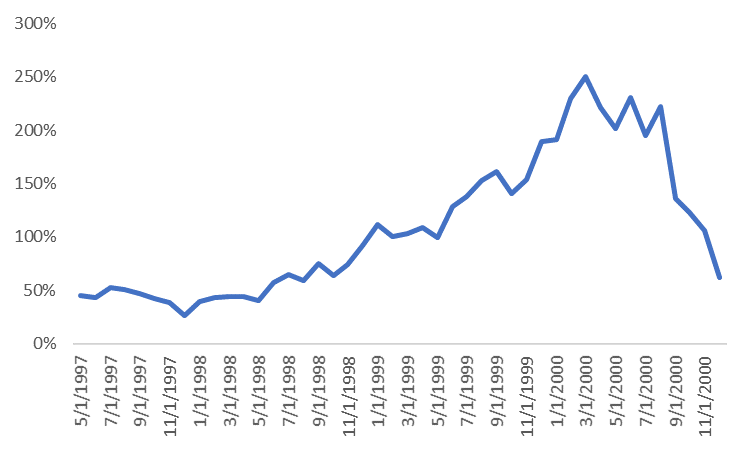
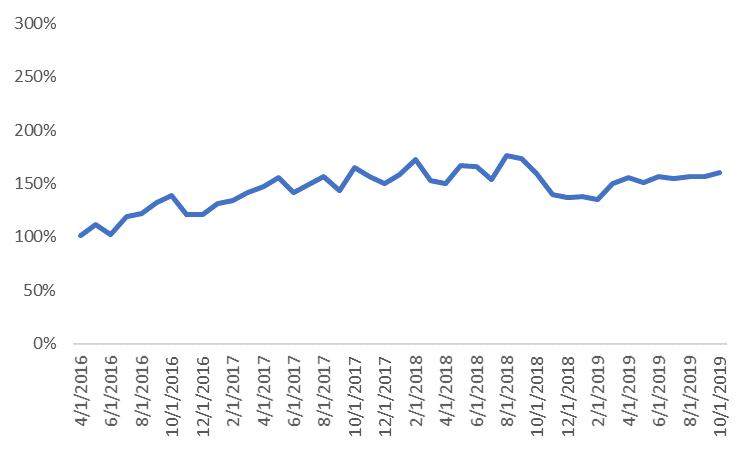
Figure 1 shows that the upsides are quite similar, but the current rise in stock is happening at a slightly lower, steadier rate than in the 90s. Technically, a bubble is characterized by a rapid escalation in prices, and this is not what we observe today.
pricesFigure 1: Cumulative performance: Then and now
Click image to enlarge
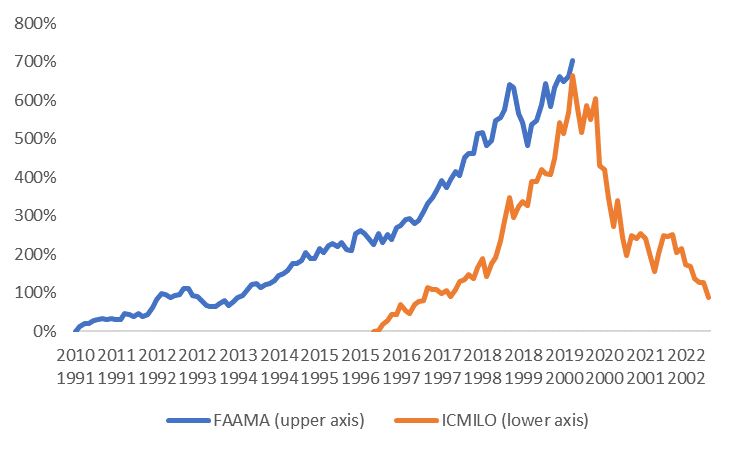
Source: Russell Investments, Datastream. Performance shown is calculated using the cap-weighted average of total return for the individual stocks included in each group. Past performance is not an indication of future performance.
A handful of companies dominate total market performance
In both periods, market leadership was relatively narrow, meaning that a small number of stocks contributed significantly to the returns of the broader market. A large portion of those star performers belonged to the technology sector. Figure 2 compares the relative performance (versus the Russell 1000 Index) of the ICMILO and FAAMA stocks with the performance of the Russell 1000 Index without those stocks. The key takeaway? While the performance of the large tech companies is still really strong today, it’s not as extreme as it was in the late 90s.
Figure 2: Rolling 3-year relative performance of largest tech stocks and Russell 1000 without largest tech stocks
Click images to enlarge
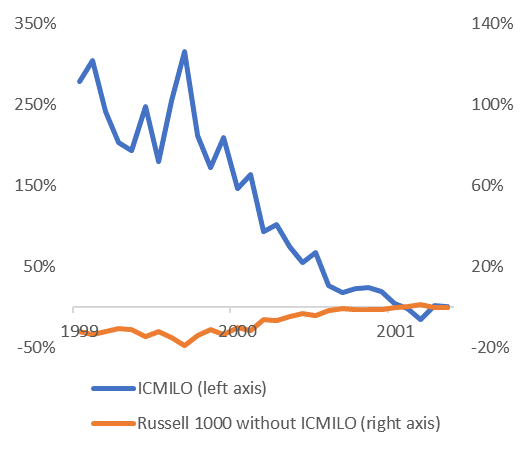
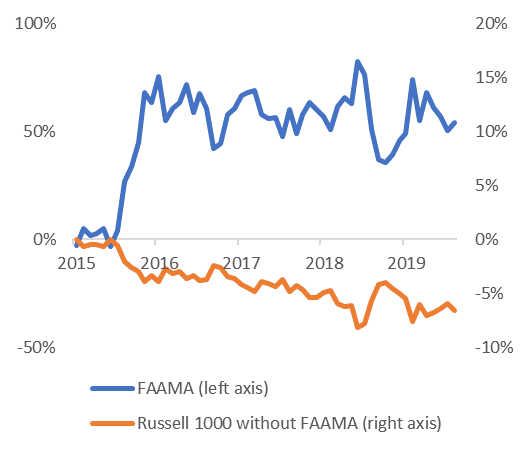
Source: Russell Investments, FTSE Russell, Datastream. Indexes are unmanaged and cannot be invested in directly. Past performance is not an indication of future performance. As of October 31, 2019.
Value investing is pronounced dead
Market environments with narrow leadership are usually not kind to value investing, which is typically pronounced dead during these times in countless blogs and articles across the internet. Indeed, we have recently been through a prolonged period of value underperformance, and we also observed similar levels of underperformance during the previous tech bubble. As 2000 demonstrated, however, these environments do not last forever, and when they dissipate, value stocks can outperform.
Figure 3: Rolling 3-year relative performance of Russell 1000 Growth and Russell 1000 Value indexes
Click image to enlarge
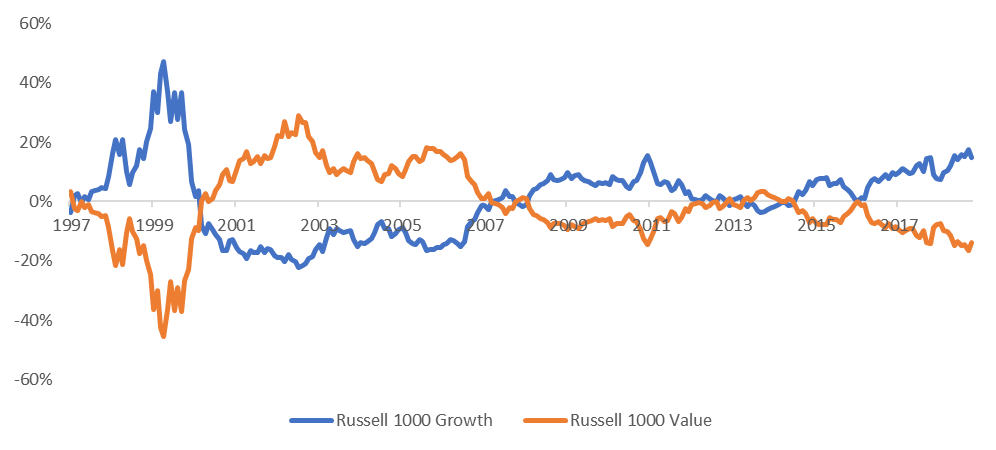
Source: FTSE Russell. Indexes are unmanaged and cannot be invested in directly. Past performance is not an indication of future performance. As of October 31, 2019.
What about tech valuations?
Technology stocks are growth stocks that, in general, trade at premiums to the rest of the market. This makes it all the more important to analyze the valuation ratios not in an absolute sense, but relative to the historical mean. In looking at one of the popular valuation metrics (price-to-sales) in Figure 4 and comparing that with the historical average premium of around 100% for the largest tech stocks, we note that even though valuations of the largest tech companies are currently high in today’s world, they are nowhere near the extremes reached during the 90s.
Figure 4: Premiums of largest tech companies relative to Russell 1000 without largest tech companies, during the dot-com bubble era (2000) and today
Click images to enlarge
Dot-com bubble
Today
Source: Russell Investments, FTSE Russell, Worldscope. Indexes are unmanaged and cannot be invested in directly. Past performance is not an indication of future performance. As of October 31, 2019.
Signals from the bond market
During the 90s boom, many tech companies that used high-yield bonds to finance themselves soon failed. Today’s technology sector has seen a large increase in BBB-rated debt1in percentage terms over the last several years2while many lower-rated issuers have received downgrades, leading some to wonder if history may repeat itself. While this is a fair concern, the default rates for tech today still look healthy.
What about IPOs?
The majority of older public tech companies are currently profitable. In contrast, most tech companies in 2000 were either loss-making or generating only marginal profits. Today, the percentage of IPOs (initial public offerings) launched in the U.S. by loss-making companies is steadily increasing—yet it’s important to note that not all are tech companies (Figure 5).
Figure 5: Performance of IPOs

EPS=Earnings per share
High Venture Capitalist funding and overvalued companies
Venture capitalists have been pouring money into tech companies at levels similar to those of the dot-com bubble.3 According to a recent paper by Gornall and Strebulaev, unicorns—which are private companies with reported valuations above US$1 billion—are overvalued by almost 50%.4 Some anecdotal evidence, e.g., the WeWork story, only supports the argument that the private tech market is overheating.
The bottom line
Similar to the late 90s, market performance today is strong and dominated by a small number of tech-related companies, while value stocks are likewise underperforming. Tech IPO and private markets are hot, and price-insensitive buying has pushed valuations to high levels. The profitability of the public tech sector has, however, risen significantly over the years, and balance sheets are strong—in contrast to the dot-com era.
It’s crucial to understand, however, that even the absence of some of the features that characterized the bubble of the late 90s, today’s technology and communication sectors can still experience a reversal in performance. It’s also important to note that these sectors are facing increased regulatory scrutiny. When combined with rich valuations, we believe both of these factors have the potential to curtail tech’s cycle of outperformance. A small underweight to U.S. and growth stocks may be the best way to prepare for this.1An ‘AAA’ rating is deemed to be the highest quality bonds with the lowest risk of default. Ratings are ordered from highest quality to lowest. A D rating indicates a debt that is in default.
2 https://www.sec.gov/spotlight/fixed-income-advisory-committee/jp-morgan-how-big-is-the-bbb-risk.pdf
3 PwC | CB Insights MoneyTree™ Report Q4 2018 (https://www.cbinsights.com/research/report/venture-capital-q4-2018/)
4 Source: https://www.nber.org/papers/w23895