Volatile month erases funded status gains
The funded status of corporate defined benefit plans fell sharply in October, driven by a selloff in global equity markets.1 After improving through the first three quarters of 2018, funded status has now retreated to near where it was at the beginning of the year.2
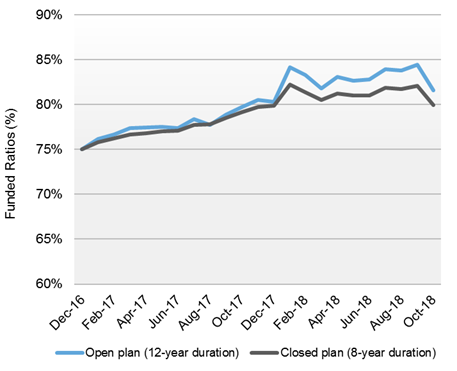
As the following chart indicates3, discount rates rose around 20 basis points early in the month and then remained stable. Heightened equity market volatility4 led to daily swings in funded status of over 1%, with the ultimate result being a decrease of around 3% for the month.
Plan management considerations
Given that market risks are growing, we recommend that sponsors actively monitor their funded status. We undertake this exercise on behalf of most of our clients, but this can also be accomplished through coordination with the plan's actuary, investment provider, and custodian. In times when market volatility increases, waiting for a quarterly meeting cycle can often lead to missed opportunities to de-risk the plan
Many of the plan sponsors with whom we work have put de-risking glide paths in place, but for those that have not, we strongly suggest having a plan in place to change liability-relative risks as appropriate. Waiting for perfection (peak equity markets and peak interest rates) can be folly and lead to regret that action was not taken sooner. We find that the pain of holding risk for too long and experiencing a sharp decline in funded status is often worse than any upside that is missed by de-risking too early.
Finally, as markets and risks evolve over the coming months and years, plan sponsors could also consider proactive de-risking, meaning moving to a lower risk portfolio ahead of any glide path triggers being breached. Should recessionary warning signs start to appear more imminent, it may be prudent to accelerate a move to a less risky liability-relative portfolio to better maintain these funded status gains.
1 The MSCI All Country World Index returned -7.6% in October
2 The following chart shows the month-to-month change in funded status for two notional pension plans (the "open plan" and "closed plan" respectively) with projected liability cash flows based on the Standard Cashflow Generator (SCG) formula and a duration of 12 years (8 years for the closed plan), discounted using the Merrill Lynch discount curve, and asset returns based on the returns of 60% (40% for the closed plan) of the MSCI World Index and 40% of the Bloomberg LDI 12-year index (60% of the Bloomberg LDI 8-year index for the closed plan). The funded status is updated at the end of every January to reflect the median funded status of the Russell 3000 Index as reported in prior fiscal year-end disclosures. These data include unfunded and non-US pension liabilities, and so are skewed lower than the true funded status using only US-based pension plans. For details of the SCG formula, see "The SCG Standard Cashflow Generator" by Bob Collie (Russell Investments Viewpoint, March 2012).
3 This chart displays the daily calculated discount rate and funded status during October 2018 for the notional "open plan" described in note 2.
4 The VIX increased from 12 to over 25 during the month
AI-27007-12-21