Two steps forward, one step back: Pension plans’ funded status since 2008
Since 2008, the recovery in funded status among pensions plans has been sporadic, following a pattern that can loosely be described as two steps forward, one step back. We’ve tracked monthly liability-driven investing (LDI) data that measures short-term changes in two representative plans’ funded status due to variations in interest rates and investment returns. What does the longer-term pattern show for a typical pension plan’s funded status?
Background
The funded status numbers that we’ve tracked are based on two hypothetical plans—one open and one closed—designed to be representative of a broad range of actual corporate pension plans. See the disclosures section at the bottom of this post for more detail on the assumptions we make for the representative plans.
Short-term impacts
Our monthly LDI data shows the short-term effects of variations in interest rates and investment returns on the funded status of these representative plans. For example, in March 2018, interest rates and global equity markets both fell. This resulted in a reduction of roughly 0.7% in the funded status of the representative closed plan and roughly 1.5% in the funded status of the open plan.
Long-term impacts
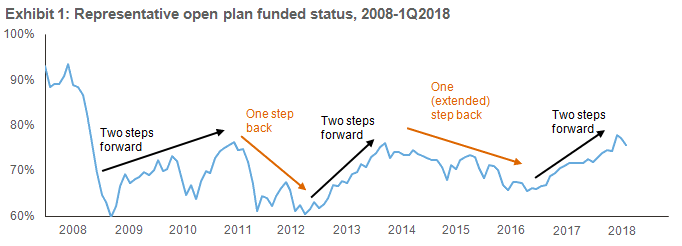
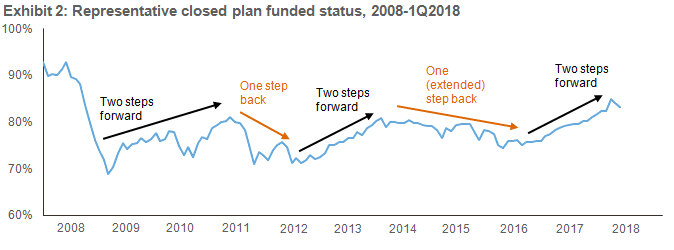
Broadening the lens to the past ten years, exhibits 1 and 2 below show how the funded status of each of the plans would have developed from the start of 2008 to the end of the first quarter of 2018, had changes in interest rates and investment returns been the only contributing factors.
Together, the charts show that market conditions have been overall favorable since the sharp decline of 2008. The recovery in funded status has, however, been sporadic—in line with our observations of a two steps forward, one step back pattern. Notably, the gains of 2009 and 2010 were largely surrendered in 2011, and the gains of 2012 and 2013 were partially given back in 2014 through 2016. 2017 again brought improvement in funded status.
Other impacts on funded status
Funded status is also affected by other factors. Most notably, to the extent that plan sponsor contributions exceed (or lag) the value of new benefit accruals, this leads directly to an improvement (or a decline) in funded status. The timing, direction and size of this effect varies from plan to plan and is not captured in the monthly data. This can lead to divergence over the longer term between the representative plans’ situations and the typical funded status of actual plans as the cumulative effect of contributions and accruals drives actual funded status up or down. To limit the extent of the divergence, the funded status of the representative plans is rebased annually to reflect actual plan funded status as reported by corporations. We describe how this is done in the disclosures section.
Another factor that affects funded status is demographic experience. This generally has a much smaller impact on funded status than the other factors mentioned so far. However, publication of mortality tables by the Society of Actuaries, described in Owens (2014), resulted in a one-off increase in liabilities of the order of 5% to 7% for most plans, and a corresponding drop in funded status. Further adjustment to these mortality tables has caused smaller adjustments to liability values in recent years. This will not affect the month-to-month calculations of funded status in our tracking database (because those calculations capture purely the impact of variations in interest rates and investment returns), but will in due course be captured as part of the annual rebasing.
Summary
The monthly data that we’ve tracked shows that changes in interest rates and investment returns over the past ten years have had an overall beneficial effect on the funded status of pension plans, although there have been some setbacks during this time period (specifically, in 2011 and 2014-2016).