2022 capital gain distributions: When it rains, it pours
You may have heard the saying "bad things come in twos or threes." Picture yourself happily driving down a country road enjoying the scenery and then pop! there goes your tire. As you pull over to stop, your engine ka-chugs and stops running. You are out of gas.
What does this have to do with investments, and what does this have to do with taxes, you may be wondering? Well, it appears very likely that 2022 is going to end with negative returns across most major asset classes. While investors may be forgiven for thinking that means the tax bill on their non-qualified accounts is likely to be zero, that is sadly not the case. (Unless, of course, they are invested in tax-managed funds.) It’s quite possible that many of your clients will have a flat tire (negative investment returns) and run out of gas (get hit by capital gains taxes) at the same time.
Capital gains taxes, investment returns and history
Looking at historical patterns, we can see that this has happened before. While history isn’t always a perfect predictor of what will happen, there are lessons to learn from the past.
Click image to enlarge

Source: Morningstar Direct. U.S. Stocks: Russell 3000® Index. U.S. equity funds: Morningstar broad category ‘US Equity’, all other categories are based on Morningstar Category Group each including mutual funds and ETFs. For years 2001 through 2013, used oldest share class, 2014 forward includes all share classes. Average Capital Gain Distribution % = calendar year cap gain distribution ÷ year-end NAV (For years 2001 through 2020), = total cap gain distribution ÷ respective pre-distribution NAV (For 2021). Indexes are unmanaged and cannot be invested in directly. Returns represent past performance, are not a guarantee of future performance, and are not indicative of any specific investment.
The chart above shows the average capital gain distributions in U.S. equities since 2001. Let’s start by looking at the year 2018, in which U.S. equities returned -5% but the average capital gain distribution was the second-highest in the period at a whopping 11% of net asset value (NAV)! And in 2015—an essentially flat year—investors received a 10% capital gain distribution, the third-largest over the timespan shown.
What about a year with a sizable market drop, such as 2008? While the market’s performance in 2008 was quite different than it has been in 2022, it could hold a lesson for us. The market declined by almost 40% in 2008, and yet the average capital gain distribution that year was 8%. This gives us an idea of what might be in store for investors this year. We know enough from history as well as recent estimates from fund companies that for many investors, their capital gains tax bill will not be zero.
Estimated capital gains: What we know so far
We are close enough to the end of the year to draw some conclusions from capital gain estimates. The three key takeaways so far are:
- Capital gains distributions are going to be larger than many investors are expecting
- U.S. equities are expected to have the largest distributions
- Fixed income is going to have capital gains distributions
Click image to enlarge
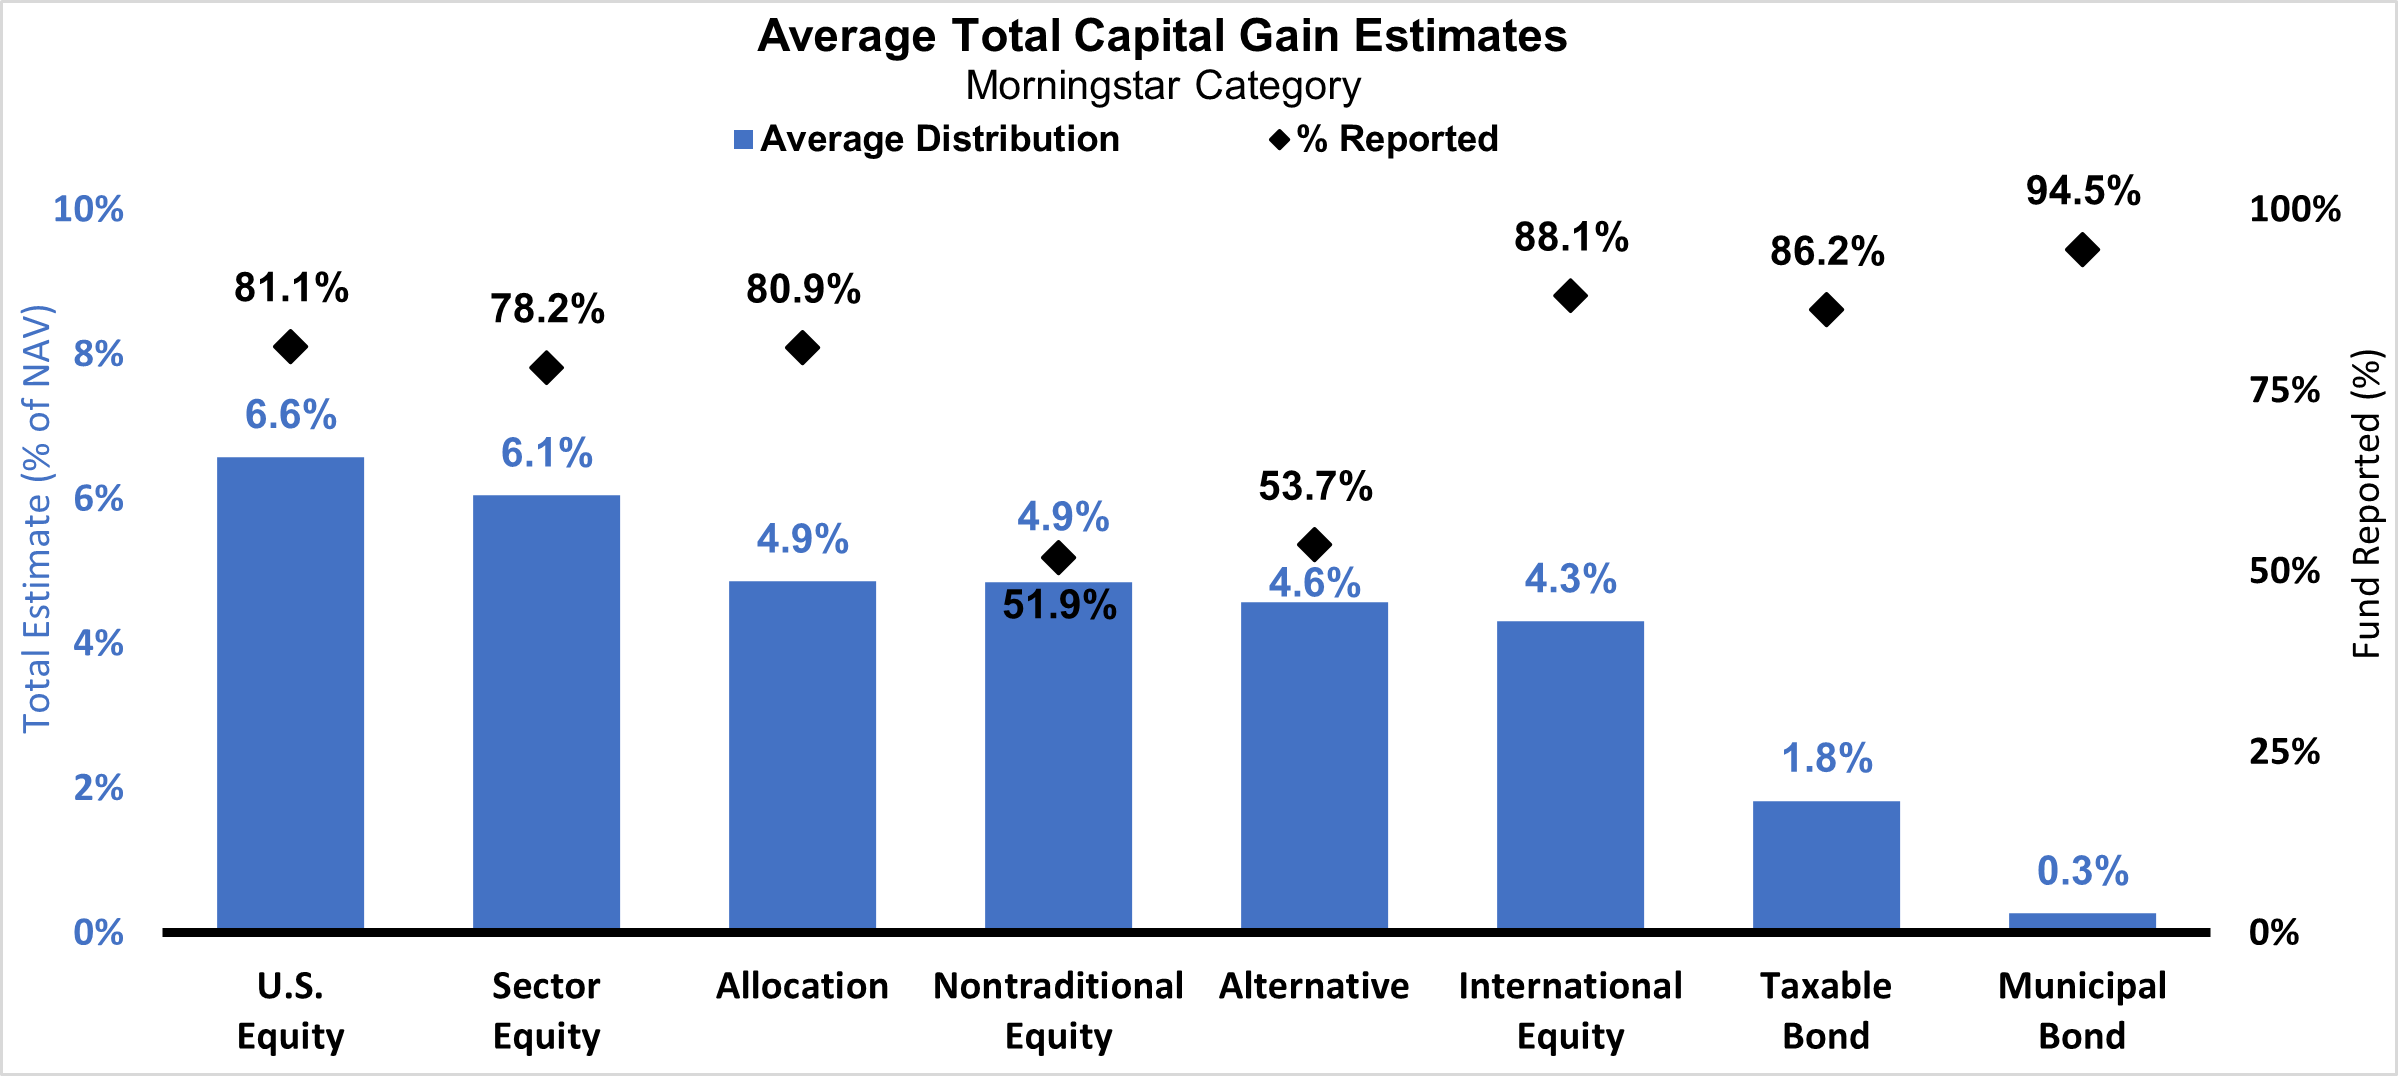
Source: Russell Investments and Morningstar Direct, as of 11/29/2022. Categories based on Morningstar Category Group which includes mutual funds and ETFs (and multiple share classes). The average capital gain distribution % is calculated using the total capital gain distribution and respective pre distribution NAV as reported by Morningstar. % of NAV is calculated as (total capital gain distributions ÷ respective pre distribution NAV).
Capital gains distributions: U.S. equities expected to outpace other asset classes
On average, U.S. equities are expected to produce a nearly 7% capital gain distribution, the highest estimate of all asset classes surveyed. However, there will likely be some variation between broad market and sector funds as well as market cap segments and styles.
It should come as no surprise that U.S. equities are most likely going to have the largest distributions, since the performance of U.S. stocks has dominated returns over the last decade. That outperformance means there are more embedded gains in U.S. equities, and hence larger capital gain distributions. How much of your clients’ portfolios are invested in U.S. equities? If they are like the average U.S. investor, it’s probably fair to say that the lion’s share of their equity exposure is in U.S. large cap names.
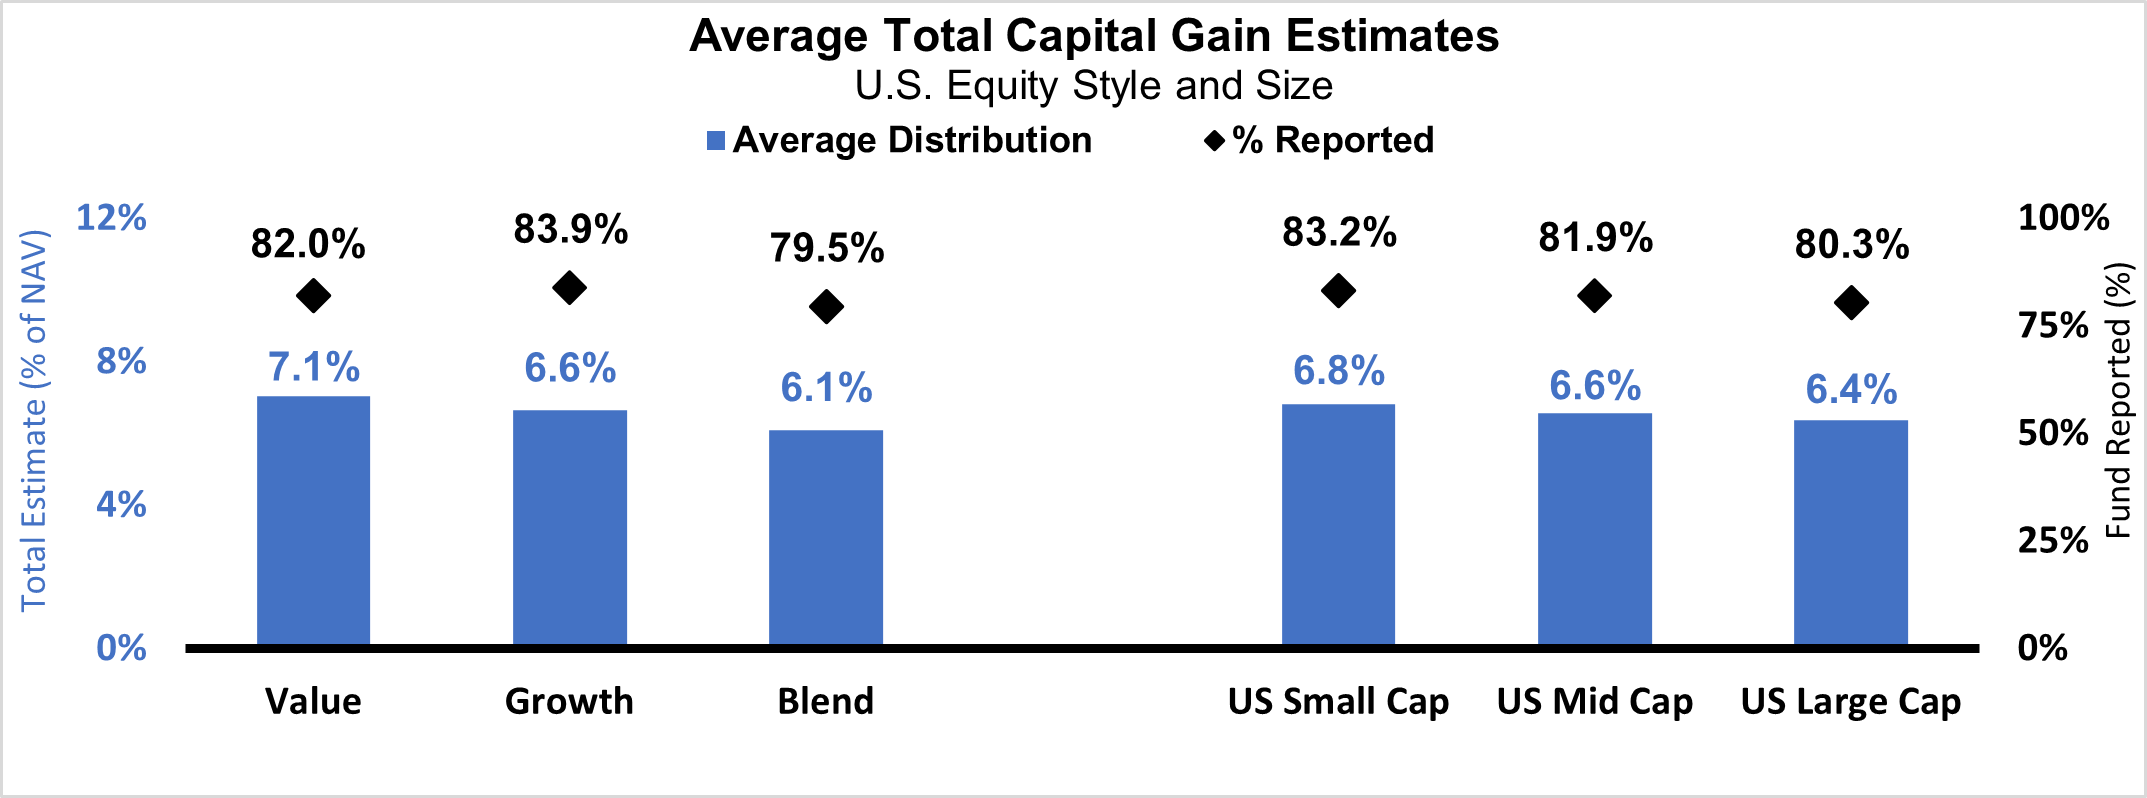
Does style or market capitalization influence the size of capital gain distributions?
Style as well as market capitalization matters. But how much impact does it have on investors’ tax bills through their capital gain distributions? That will depend on how investors’ assets are allocated. In short, value funds are expected to have some of the larger distributions this year. According to our research, U.S. equity funds with a value orientation are expected to distribute an average of 7.1% of NAV in capital gains. This doesn’t mean that growth funds are expecting to get away scot-free: growth-oriented U.S. equity funds are expecting an average 6.6% distribution. Small-cap-oriented funds are expecting a slightly larger capital gain distribution compared to large and mid-cap funds, but not by much. The difference across the capitalization spectrum isn’t that big from category to category.
Click image to enlarge
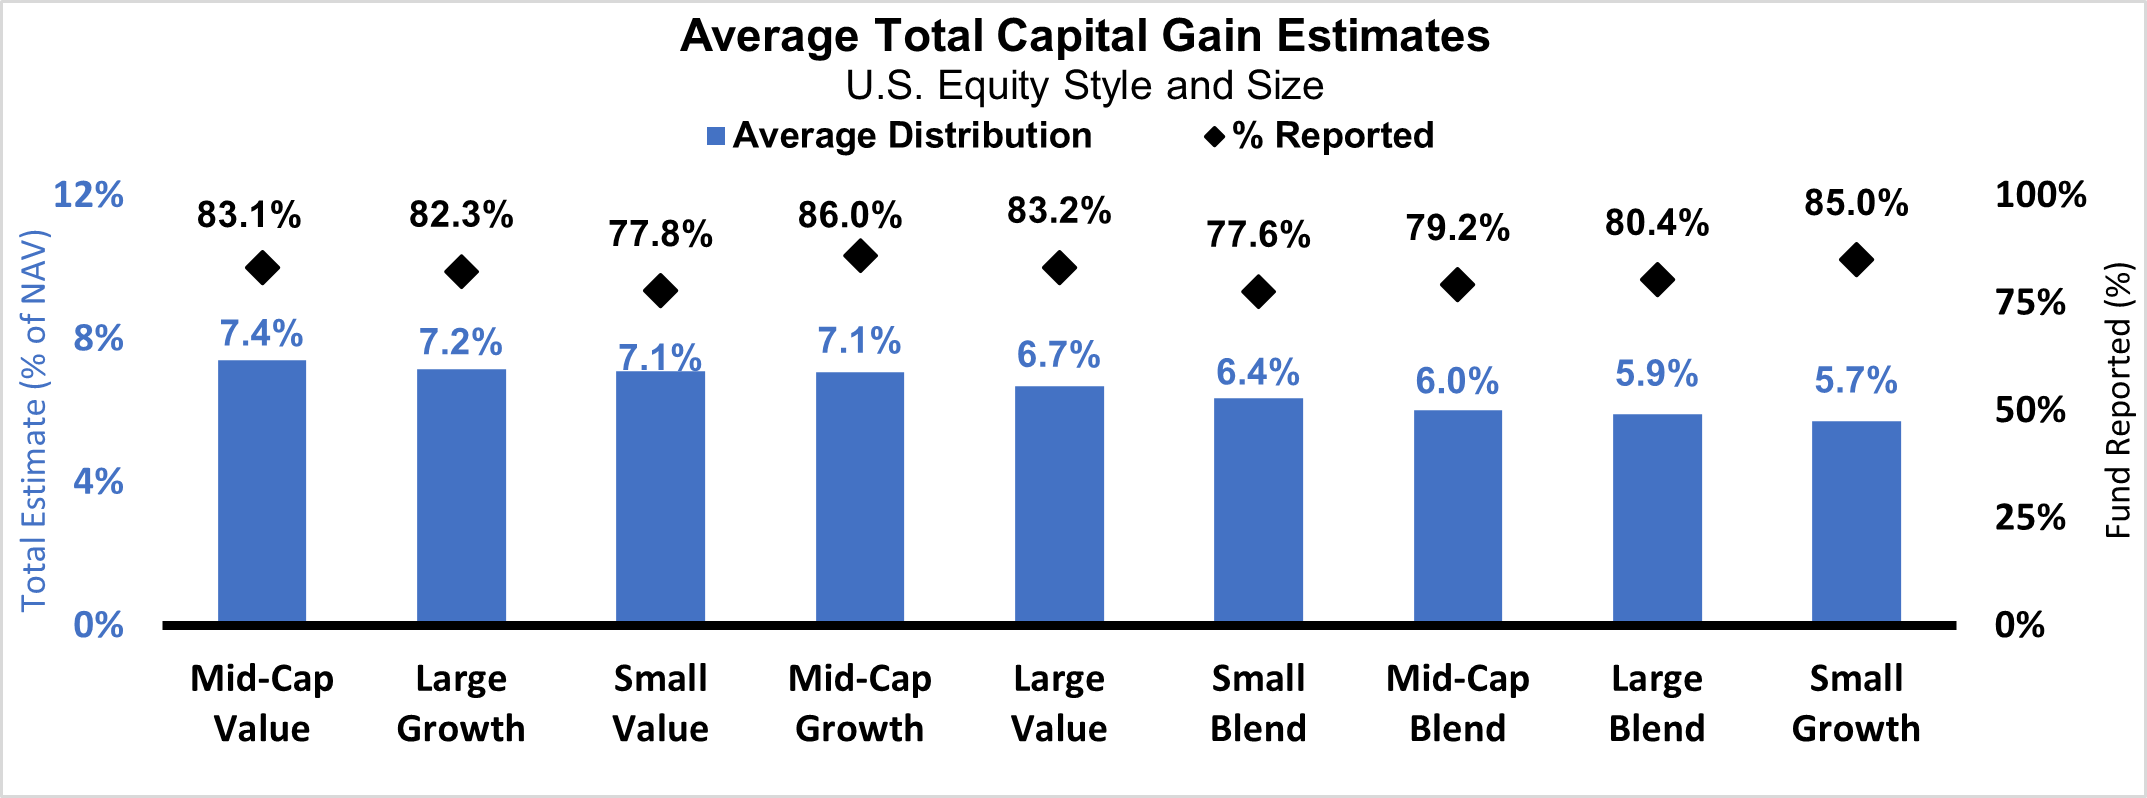
Source: Russell Investments and Morningstar Direct, as of 11/29/2022. Categories based on Morningstar Category Group which includes mutual funds and ETFs (and multiple share classes). The average capital gain distribution % is calculated using the total capital gain distribution and respective pre distribution NAV as reported by Morningstar. % of NAV is calculated as (total capital gain distributions ÷ respective pre distribution NAV).
The same is largely true when we look across market capitalization and style. Funds in the core segment where growth and value are blended are faring a little better, as are small cap growth funds, when it comes to capital gain distributions. But that still means expected distributions of 5.5%-6.5%. Small and mid-cap value funds are at the upper end of the expected distribution range at close to 7.5%. Any which way one looks at these numbers, there are capital gain distributions coming at year-end that may be a negative surprise to a lot of investors!
Click image to enlarge
Source: Russell Investments and Morningstar Direct, as of 11/29/2022. Categories based on Morningstar Category Group which includes mutual funds and ETFs (and multiple share classes). The average capital gain distribution % is calculated using the total capital gain distribution and respective pre distribution NAV as reported by Morningstar. % of NAV is calculated as (total capital gain distributions ÷ respective pre distribution NAV).
Capital gain distributions from fixed income? It happens.
Too often investors in fixed income are singularly focused on income in the form of interest payments. But fixed income funds can and do generate capital gain distributions. In fact, there are fixed income managers that actively look to trade bonds to generate returns. Even in the municipal bond category, where income is generally considered to be tax free, capital gains occur. As the chart below indicates, several fixed income categories are expecting fairly large (by fixed income standards) capital gain distributions.
| Taxable bonds | Total estimated distribution | % of funds reported |
| U.S. fund intermediate core bond | 0.15% | 83% |
| U.S. fund intermediate core-plus bond | 1.38% | 85% |
| U.S. fund multisector bond | 2.75% | 80% |
| U.S. fund global bond | 1.11% | 87% |
| U.S. fund global bond-USD hedge | 4.32% | 97% |
| Municipal bonds | Total estimated distribution | % of funds reported |
| U.S. fund high yield muni | 0.33% | 98% |
| U.S. fund muni national intermediate | 0.18% | 90% |
Source: Russell Investments and Morningstar Direct, as of 11/29/2022. Categories based on Morningstar Category Group which includes mutual funds and ETFs (and multiple share classes). The average capital gain distribution % is calculated using the total capital gain distribution and respective pre-distribution NAV as reported by Morningstar. % of NAV is calculated as (total capital gain distributions ÷ respective pre-distribution NAV).
Tax-managed Investing: The way forward
Just like an empty gas tank while driving, many investors find taxes to be an inconvenient reality when their investments are doing well. But it becomes more difficult to think about and understand the impact of taxes when investments are down. Not only does it not make sense to many investors that they are paying taxes when their portfolio has declined, but it has also cost them real money. Taxes are arguably permanent capital destruction when it comes to an investment portfolio. Paying investment taxes in a year when the market has fallen just makes the hole deeper. Help your clients stop digging that hole by transitioning to tax-managed investing. After a year such as 2022, tax-managed investing can help investors by minimizing their tax burden and providing them with greater peace of mind. And ensuring the bite of taxes doesn’t further reduce their portfolio’s returns demonstrates the real value of your client relationship and planning advice.