Flavor of the croissants: An analysis of why we still remain cautious about the economic outlook
Executive summary:
- The Federal Reserve (the Fed) has made some relatively painless progress thus far in its inflation fight.
- Some other prominent economists have walked back their forecast for a near-term recession.
- However, we believe a mild-to-moderate recession in the U.S. and other major developed market economies (e.g., Canada, the U.K., and Europe) is the most likely outcome for 2024.
The bottom line: We think investors should stay cautious and disciplined amid a likely (but not inevitable) recession in the next 12-18 months.
Introduction
When I was in fifth grade, one of my French teachers held a croissant-selling event. He offered us two types: chocolate-filled croissants and butter-filled croissants. The croissants had markedly different tastes, but they looked quite similar from the outside. Without biting into the croissants, it would have been difficult to discern which was which.
Investors today face a similar challenge. The U.S. Federal Reserve has undertaken aggressive interest rate hikes in a bid to bring inflation back down to its target. Thus far, the progress has been relatively painless. But whether this mission will end in a soft landing or a recession remains an open question.
In late 2022, many forecasters were warning of elevated recession risks in the near-term outlook (approximately 12-18 months ahead). But in the summer of 2023, several prominent economists walked back their recession forecasts. And the market itself seems to be more focused on a higher-for-longer interest rate regime rather than pricing in recession risks.
From our perspective at Russell Investments, we think a recession in 2024 is possible and the most likely outcome.
The croissance is still tasty: the remarkable resilience thus far of some of the U.S. economic data
While consumers often care about how tasty their croissants are, we prefer to examine the croissance instead (la croissance économique = economic growth). The state of the economy is a crucial part of the Cycle, Valuation, and Sentiment framework we use here at Russell Investments.
It's an understatement to say that the COVID pandemic significantly impacted the U.S. economy. The U.S. experienced a sharp economic slowdown in early 2020, followed by an unexpectedly quick recovery. While market observers initially cheered the economic rebound, the economy quickly became overheated. A bout of high inflation soon followed.
Although the Federal Reserve (the Fed) initially viewed the inflation as "transitory," Fed officials eventually recognized that they had to act. In March 2022, the Fed kicked off what would become the most aggressive interest rate hiking campaign since the era of Paul Volcker.
As the Fed hiked interest rates, we became more concerned about the economic outlook. Although it's not impossible for the Fed to achieve a soft landing, the historical record is not on the Fed's side.
By October 2022, the Fed had raised interest rates by around three full percentage points, taking interest rates above our estimate of the neutral rate of interest and into restrictive territory. This means that the interest rates had hit a level that could be expected to drag on economic growth. And the Fed had signaled that more rate hikes were still in the pipeline.
Against this backdrop, we raised our near-term (12-18 month) recession probability to 55%. Many other forecasters also began issuing recession warnings.
How prevalent was the recession concern at the time? One popular gauge of near-term expectations for recession risk comes from the Survey of Professional Forecasters, a research survey run by the Federal Reserve Bank of Philadelphia. One of their survey questions asks respondents to rate the probability of GDP growth being negative in a year's time.
While the question is a bit different than directly asking the probability of a recession, looking at the survey results compared to the historical record can still be a useful gauge.
Survey of Professional Forecasters:
Probability of Negative GDP Growth in 1 Year
(Click image to enlarge)
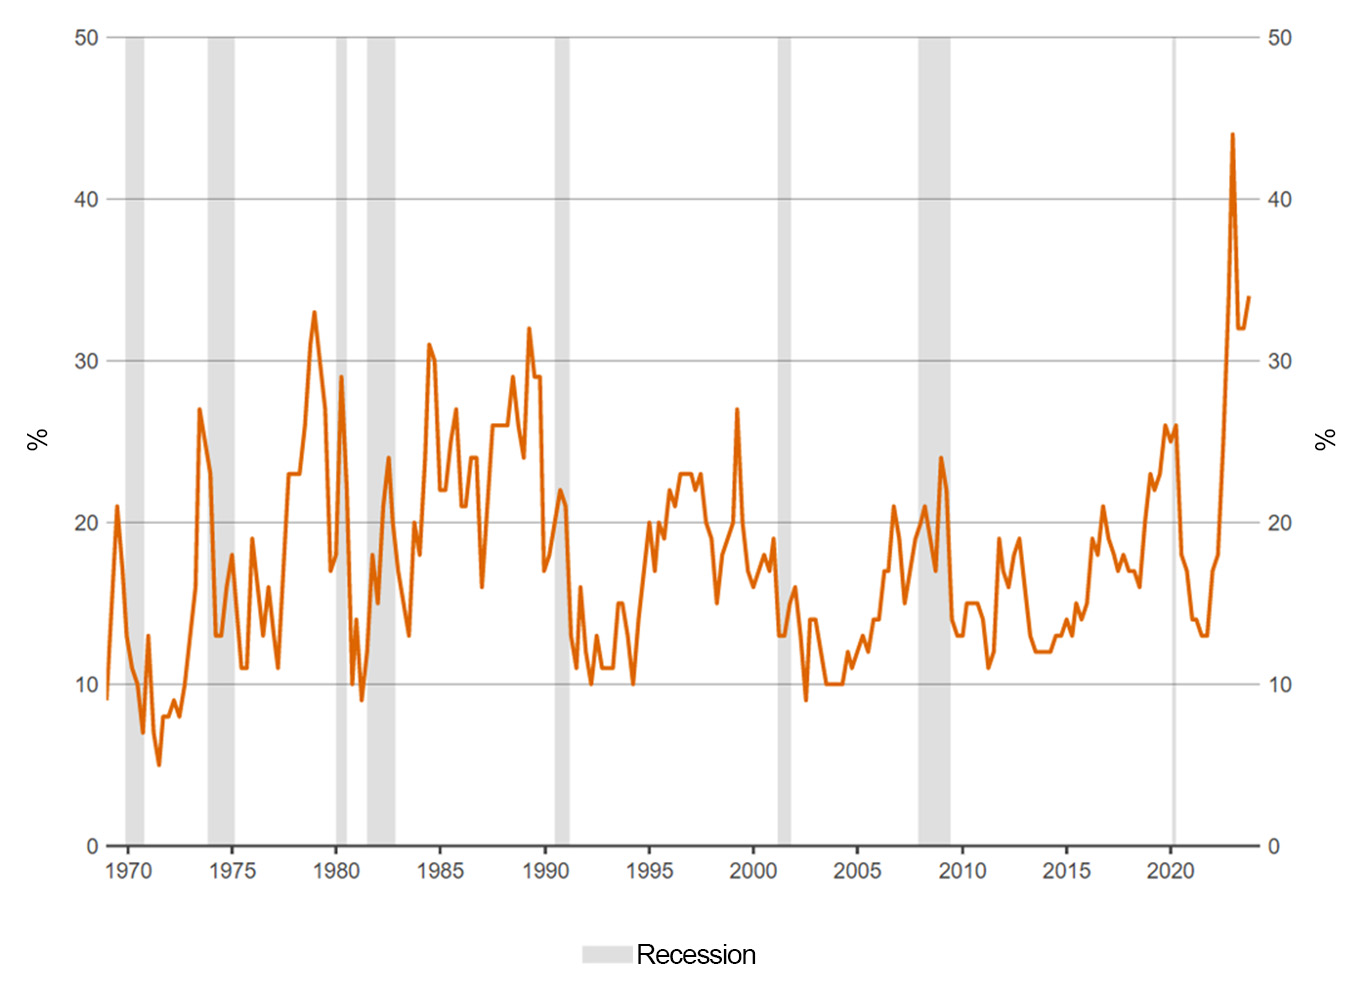
Source: LSEG Datastream, data through Q3 2023
The probability of negative GDP growth in one year's time reached a relatively elevated level of 42% in Q4 2022, an all-time high in the survey.
This led to some comments about the 'most anticipated recession.'
In 2023, the Federal Reserve continued its interest rate hiking campaign. The interest rate hikes seemed to have the intended effects of cooling inflationary pressures. Core Personal Consumption Expenditure (Core PCE) year-over-year inflation moderated to 3.9% in August 2023, compared to the 5.6% y/o/y peak in 2022. Of course, that's still above the Fed's 2% inflation target.
Meanwhile, U.S. GDP grew at a seasonally adjusted annualized rate (SAAR) of 2.2% in Q1 2022 and 2.1% in Q2 2022. That's a fairly robust growth rate and above the Fed's estimate of long-run potential economic growth.
In summary, it appears that the U.S. economy has been more resilient than we had anticipated and that the progress made by the Fed so far in its inflation fight has been relatively painless. The table below summarizes how key economic indicators have evolved. Note the data in the table reflect data available as of the indicated timeframe rather than data pertaining to the stated timeframe. For more details on individual economic indicators, please refer to the Appendix.
| Data available as of Oct. 2022 | Data available as of Oct. 2023 | Target |
|
| Core PCE Inflation, YoY % | 5.2% | 3.9% | 2% |
| GDP Growth, SAAR | -0.6% | 2.1% | 1.8% |
| Unemployment rate (%) | 3.7% | 3.8% | 4.0% |
| 3-month trailing average job creation | 430,000 | 266,000 | 77,500 |
| Quits rate (%) | 2.6% | 2.3% | 1.9% |
| Labor demand to labor supply | 1.03 | 1.02 | 0.97 |
Source: Russell Investments calculations based on data from LSEG Datastream. The table looks at the latest data available as of Oct. 1, 2022 and Oct. 13, 2023. Labor demand to labor supply ratio is expressed as the sum of job openings and employed workers, divided by the sum of employed and unemployed workers. ‘Target’ represents the Fed’s target rate for inflation. For GDP Growth and Unemployment Rate, ‘Target’ represents the Fed’s estimate of the long-run values of these datapoints based on the Sept. 2023 FOMC projections. ‘Target’ for the Monthly job creation represents the Atlanta Fed’s estimate of the pace of monthly job creation need to achieve a 4.0% unemployment rate over 12 months. ‘Target’ for the Quits rate and job openings to unemployed ratio represents the average value observed from December 2000 to December 2019 for these statistics.
Why some forecasters hold a soft landing view
The apparent resilience in the economy has led some forecasters to reconsider their outlook. Indeed, in recent weeks, we have seen some economists walk back their calls for a near-term recession and instead embracing a soft landing view. While the soft landing voices may be gaining more traction, a plethora of economists still see elevated risks. Thinking back to the Survey of Professional Forecasters chart, the median forecasted probability for negative GDP growth in a year's time dropped to around 30-35% in 2023. But that remains elevated relative to the survey's history.
Similarly, the Bloomberg Opinion Survey now has the median expected year-ahead recession probability at 55% as of September 2023, meaning that many economists still expect a recession in 2024.
Although we continue to believe that a mild-to-moderate recession is the more likely outcome over the next 12-18 months, we believe it's also important to consider the counterarguments. There are nuances from forecaster to forecaster, but a few common themes permeate among those with a soft-landing baseline.
One key argument among soft landing proponents is that because the initial stages of the Fed's inflation fight have been relatively painless, the final stages would also be relatively mild. They might believe that monetary policy's long and variable lags have become much shorter, owing to the Fed's explicit forward guidance during this interest rate hiking cycle. With the Fed likely near the end of the tightening cycle, these soft-landing proponents would argue that we have already felt the majority of the economic drag from elevated interest rates.
Another narrow argument by some soft landing proponents is that the U.S. government's quick response to the failures of Silicon Valley Bank and Signature Bank has reduced systemic risk and alleviated the recessionary concerns.
Finally, some forecasters point to the relatively robust consumer balance sheets among U.S. households as a reason for hope.
We understand the allure of a soft-landing narrative. After all, human nature yearns for "feel-good" stories. But the historical record is not on the Fed's side. While a recession is not inevitable, we still believe that it is more probable than the soft-landing scenarios being embraced by some forecasters.
Watching the calorie count: why we are still cautious about the economic outlook
Croissants are a tasty snack. But at the same time, it's important to be mindful of their high caloric content. Likewise, even though there are compelling reasons why a soft landing may occur, we think it's important for investors to be aware of the downside risk factors in the economic outlook.
First, we think it may be overzealous to extrapolate the relatively painless success the Fed has had in reducing inflationary pressures onto the remainder of the inflation fight. Although some soft-landing proponents argue that the lags of monetary policy have shortened, other economists estimate that it could take up to 18 months for the full effect of a rate hike to be felt. Given that we are only over 18 months from the Fed's initial hike in March 2022, it could very well be that more impacts are yet to be felt.
During the initial recovery from COVID-19, some companies took advantage of low-interest rates to refinance their outstanding debt. But those debt issuances don't have an infinite term. Many companies will see their bonds mature in 2024, with an even greater share experiencing bond maturities in 2025. Given that capital structuring decisions are complex, these companies may have to start planning how to refinance the debt. With the prevailing interest rates potentially being higher than when the debt was first issued, some companies may have to make difficult expense control decisions to protect profit margins.
Moreover, not all companies have fixed-rate debt outstanding. Small and medium-sized companies that obtain non-bank financing might fund their operations through variable-rate debt instead. The table below illustrates how these companies' interest rate expenses might have evolved. These companies might have seen their interest costs reach 9% in 2023; by 2024, the total interest rate could reach double digits.
| 2021 | 2022 | 2023 | |
| Effective Fed Funds Rate | 0.08% | 1.63% | 4.92% |
| Spread | 4.00% | 4.00% | 4.00% |
| Total interest rate | 4.08% | 5.63% | 8.92% |
Source: Russell Investments' calculations. Effective Fed Funds Rate is the average of the daily effective Fed Funds rate for the year, using data sourced from LSEG Datastream. Credit spread depends on factors such as the borrower's credit quality and the date the loan agreement was finalized. We have used a 4% spread for illustrative purposes.
While the corporate sector in aggregate still looks relatively robust for now, we have already seen bankruptcy rates start to tick upward (albeit from very low levels) as the higher interest rate effect becomes too punitive for some borrowers.
Thus, on a forward-looking basis, we may see a further softening of the labor market and an increase in the unemployment rate. As we alluded to in our Global Market Outlook, the dilemma could create an adverse feedback loop among higher unemployment rates, lower consumer confidence, and lower business profitability.
Moreover, many economic indicators signal that despite the resilience we are seeing now, there is still a high risk of a future slowdown. Our Recession Risk Dashboard points to many risk factors. The yield curve is still inverted, an indicator that has reliably anticipated previous recessions. Temporary help employment peaked in March 2022 and has generally been declining since October 2022—and is likely to lead to a cooling in the labor market as a whole. And bank lending activity, an important fuel for the economy, is at levels weak enough to be associated with recessions. Indeed, fighting inflation can be like squeezing toothpaste out of a tube—while the initial stages seem easy, it's hard to get the final pinches out without wringing your hands.
Russell Investments' U.S. Recession Risk Dashboard
(Click image to enlarge)
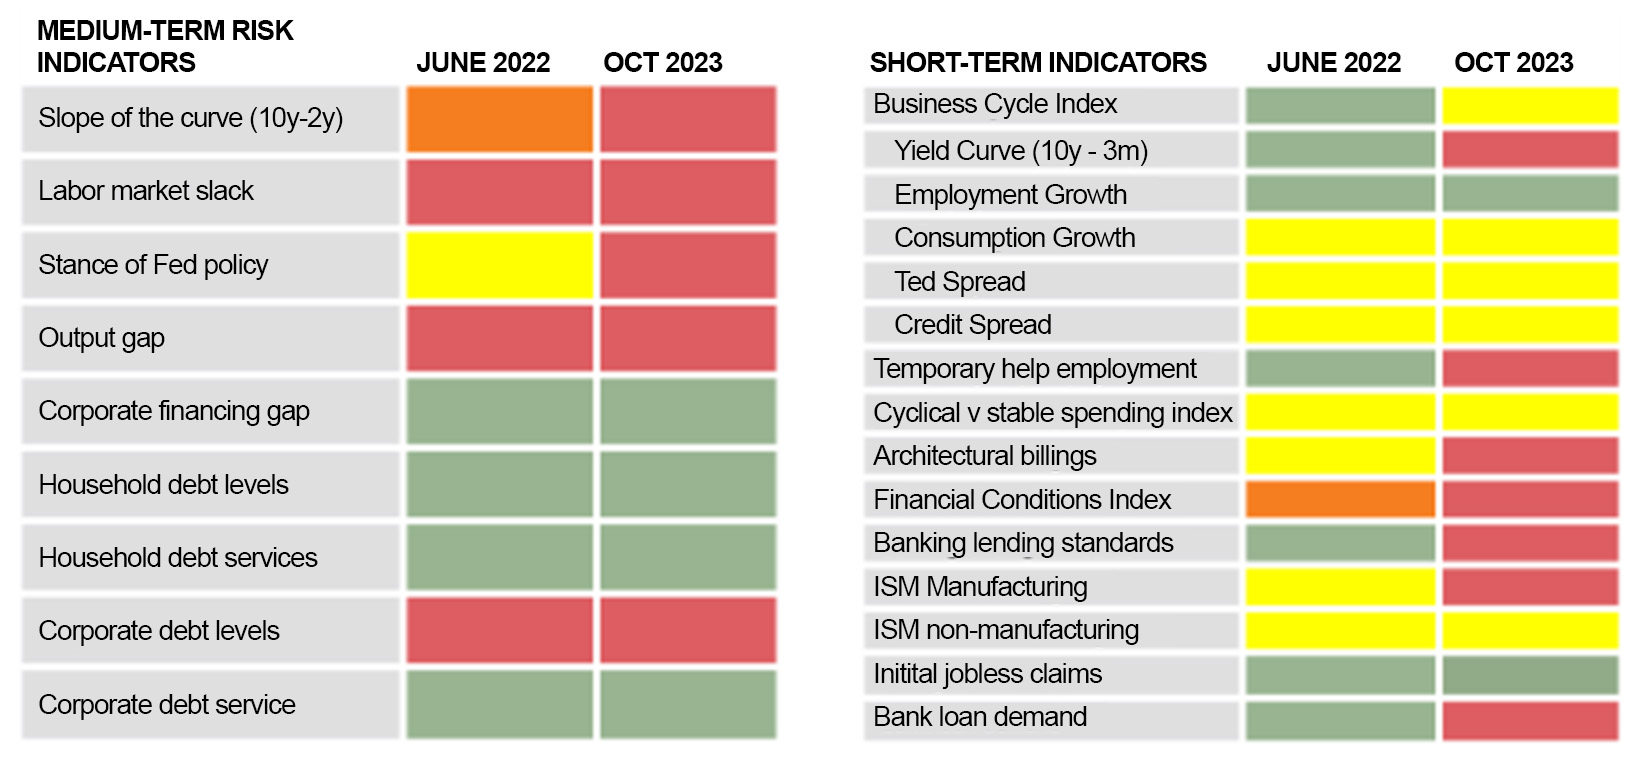
- Economic data indicators have weakened over the last year.
- Recession risks are elevated, but bright spots remain.
Source: Russell Investments, June 2022 and Oct 2023. Red denotes areas of high risk, yellow and orange denote areas of intermediate risk, and green denotes areas of low risk.
Regarding the regional banking challenges, we agree that the failures of Silicon Valley Bank and Signature Bank were likely idiosyncratic rather than systematic. That being said, the lack of systematic risk in the banking sector isn't enough in our view to prevent a recession from materializing. Instead, we believe it helps limit the potential recession's severity.
Similarly, we would argue that although household balance sheets are stronger now than they were going into previous recessions, this strength is also insufficient to avoid the possibility of a recession altogether.
Although it's not impossible for the Fed to pull off a soft landing, we believe that it would be an extraordinary feat requiring impressive wizardry.
Global foods and global risks
While the croissant may have originated in France, the interconnectedness of our world has made it a ubiquitous snack across many countries. Likewise, the challenges faced by the U.S. central bank as it tries to walk the tightrope and avoid recession are not unique to the U.S.
In the aftermath of the COVID pandemic, many other developed markets, including Canada, the UK, Europe, Australia, and New Zealand, faced elevated inflation rates. Since then, inflation rates in those regions have moderated from their peaks but are still above the targets set by their respective central banks. Moreover, the decline in inflation isn't necessarily linear. The re-acceleration of core inflation in Canada in August 2023 is an important reminder of just how difficult the final phase of the inflation fight can be.
Global Core Inflation Rates
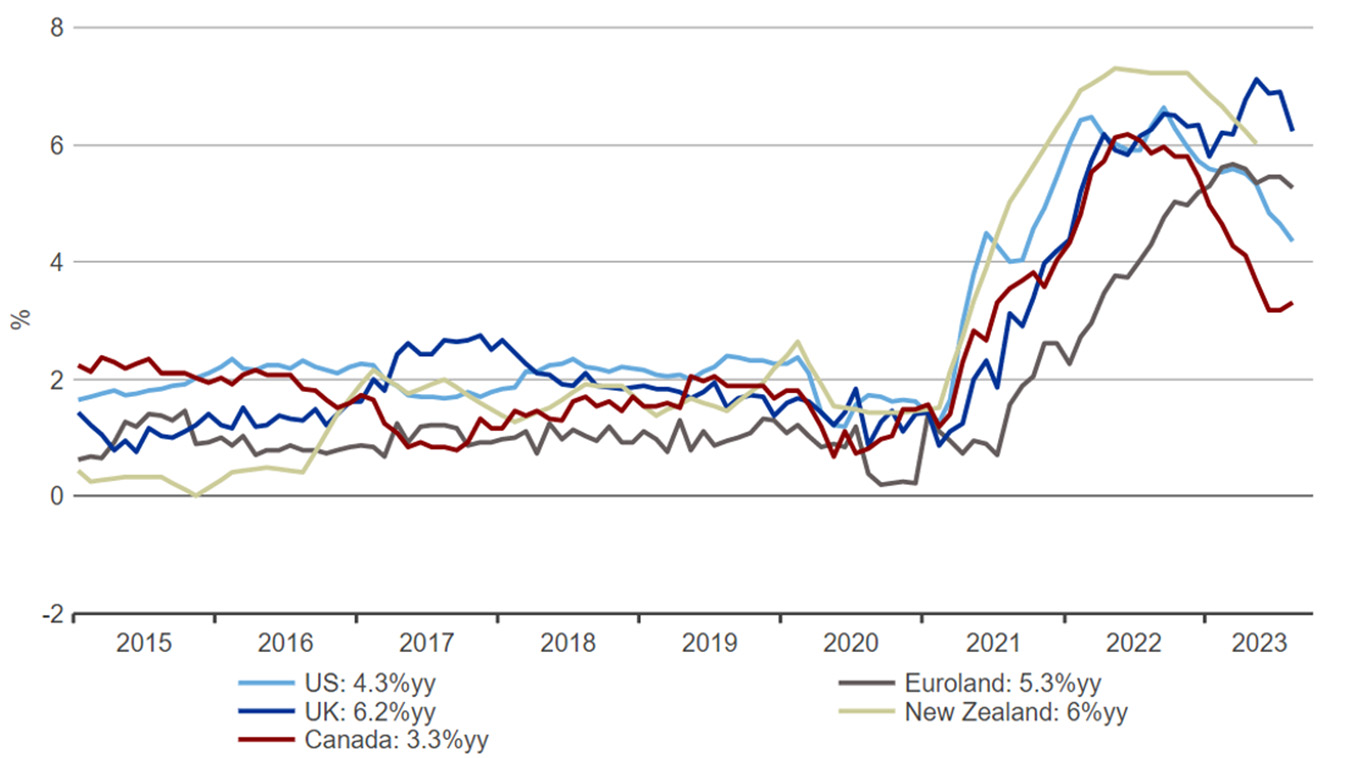
Source: LSEG Datastream, data through August 2023. Core inflation rates are calculated as inflation excluding food and energy.
In an effort to quell inflation, the central banks in these non-U.S. regions have also had to raise interest rates aggressively. We estimate that interest rates in each of these regions are already deeply restrictive and will have a dampening effect on economic activity. We believe a mild-to-moderate recession in these countries is also more likely than not in 2024.
Final thoughts
The most important thing my French teacher taught me wasn't conjugating irregular verbs. It was having a sense of humility and recognizing that life can take many twists and turns.
Forecasting the economy and the market is an inherently difficult task. We believe recession risks remain elevated, and investors may benefit from adopting a cautious, disciplined approach. At the same time, it's important to recognize that macroeconomic uncertainty is high and will likely continue to remain high in the coming months. While a mild-to-moderate recession is our baseline, central banks could still defy the odds and pull off a soft landing.
Meanwhile, markets have been somewhat choppy over the past few years. 2022 was a challenging year for equity markets, with the S&P 500 down double digits. In early to mid-2023, we saw a rebound in the S&P 500, driven by AI enthusiasm and the leadership of the Magnificent Seven mega-cap tech stocks. But even at the 2023 peak, stocks did not fully recoup their 2022 losses. And now, post the September FOMC meeting, we saw equity markets lose steam again as investors began placing more weight on a higher, longer interest rate path.
However, with the S&P 500 still sitting north of 4,000, we would argue that the markets haven't fully priced in recession risk.
Against the backdrop of high macroeconomic uncertainty and market volatility, we think that investors should adopt a balanced approach. Don't get overly optimistic when the market becomes joyful, but don't panic when markets sell off sharply. We think investors should consider favoring a neutral allocation between risky and less risky assets while perhaps making minor defensive tweaks within some of their asset classes (e.g., favoring profitable companies with strong balance sheets in their equity portfolios, favoring longer duration treasuries within the bond portfolios).
APPENDIX
Core PCE Decomposition Year-Over-Year
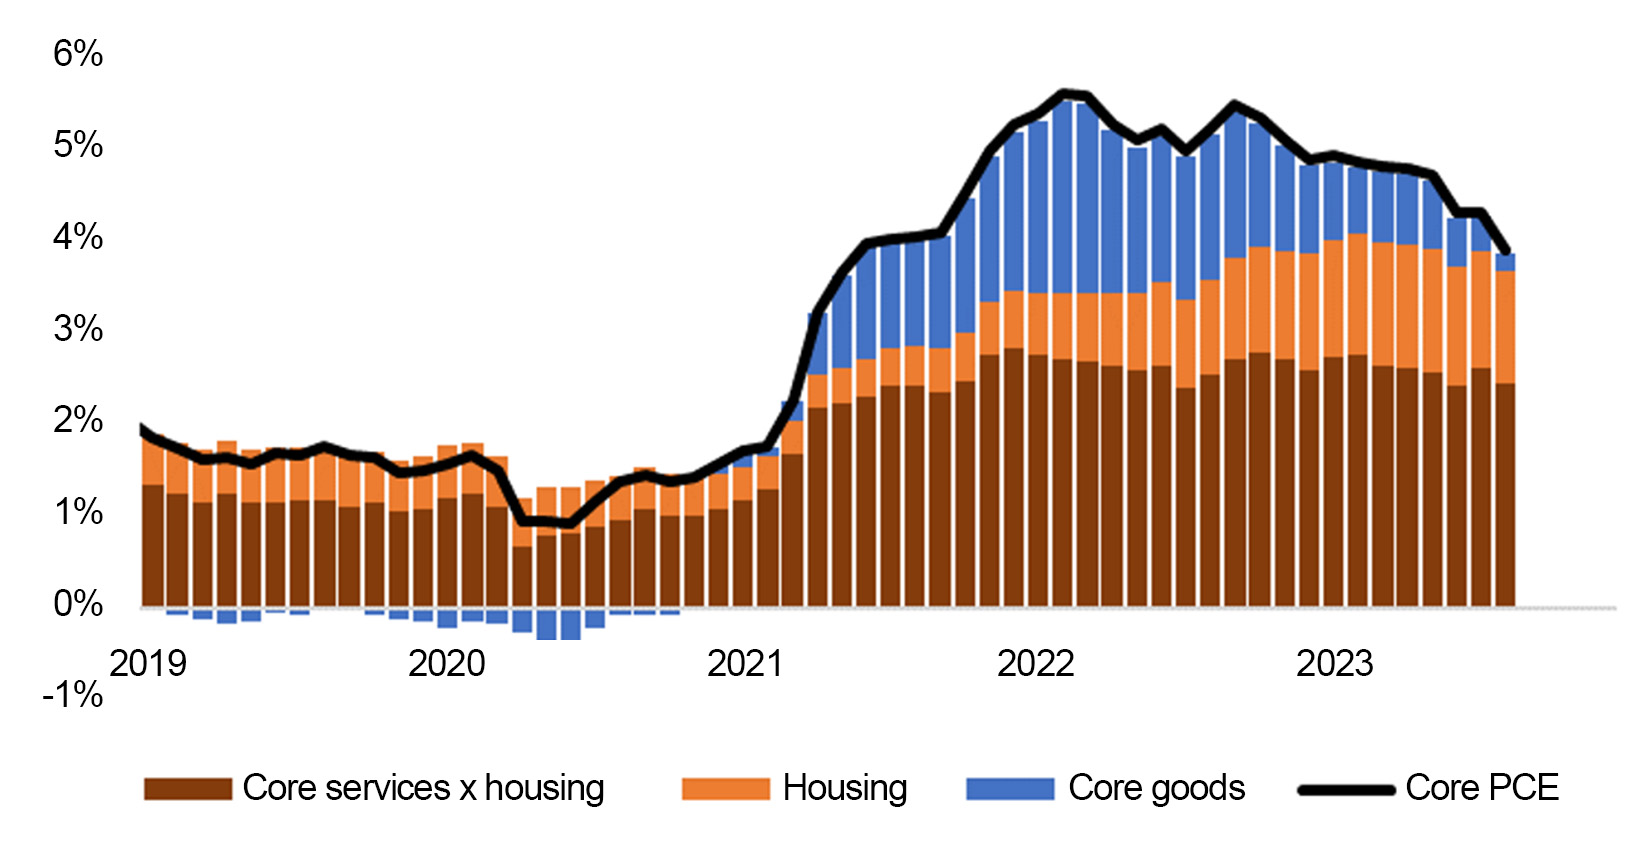
Source: Russell Investments' decomposition using data from LSEG datastream through August 2023.
In early 2022, core PCE reached inflation reached a peak of 5.6% y/o/y, nearly triple the Fed's inflation target. By October 2022, when many forecasters issued recession warnings, core PCE inflation rates were still above 5% y/o/y.
Over time, however, inflation rates moderated somewhat. As supply chains healed from the pandemic, goods inflation pressures (blue bars in the chart) eased. Core PCE inflation moderated to 3.9% y/o/y in the most recent report. While progress is welcome, inflation rates are roughly double the Fed's target.
Two principal components remain in explaining why inflation continues to run hot: shelter inflation (orange bars) and core services excluding housing (brown bars). More timely measures of shelter inflation already point to a softening to come. It is the core services, excluding housing, that may continue to pose a challenge. Whether this area of inflation cools sufficiently will depend on the state of the labor market.
In early October 2022, investors would only have had access to GDP reports for Q1 and Q2 2022. U.S. GDP contracted in both of those quarters. While volatile items like inventories and net exports contributed to the lackluster GDP results in the first half of 2022, the negative GDP print still likely weighed on investor sentiment.
Today, GDP growth appears in better shape. GDP grew at a seasonally-adjusted annualized rate of 2.2% in Q1 2023, and 2.1% in Q2 2023, a decent outcome considering the Fed estimates a longer-run potential GDP growth rate of 1.8%.
As the effect of monetary policy continues to work its way through the system, it is likely that GDP growth will slow over time. The crucial watchpoint is how much it slows. A slight slowing might be consistent with a soft landing outcome, while a sharp slowing (perhaps into contractionary territory) would be more consistent with a recessionary outcome.
The latest jobs report available to investors as of early October 2022 showed an unemployment rate of 3.7%. Today, the unemployment rate has only ticked up modestly to 3.8%. These unemployment rates are below the Fed's estimate of the Non-accelerating inflation unemployment rate (NAIRU), a longer-term sustainable unemployment rate measure. This suggests that the labor market may still be somewhat overheated.
As the impact of monetary policy continues to kick in, we would expect a continued increase in the unemployment rate. The key watchpoint is whether we only get a minor uptick or if we get a major uptick that could cause the negative feedback loop between higher unemployment, weaker consumer spending, and weaker business profits to take effect.
Nonfarm Payroll Growth
3-month average. Numbers are in hundreds of thousands.
(Click image to enlarge)
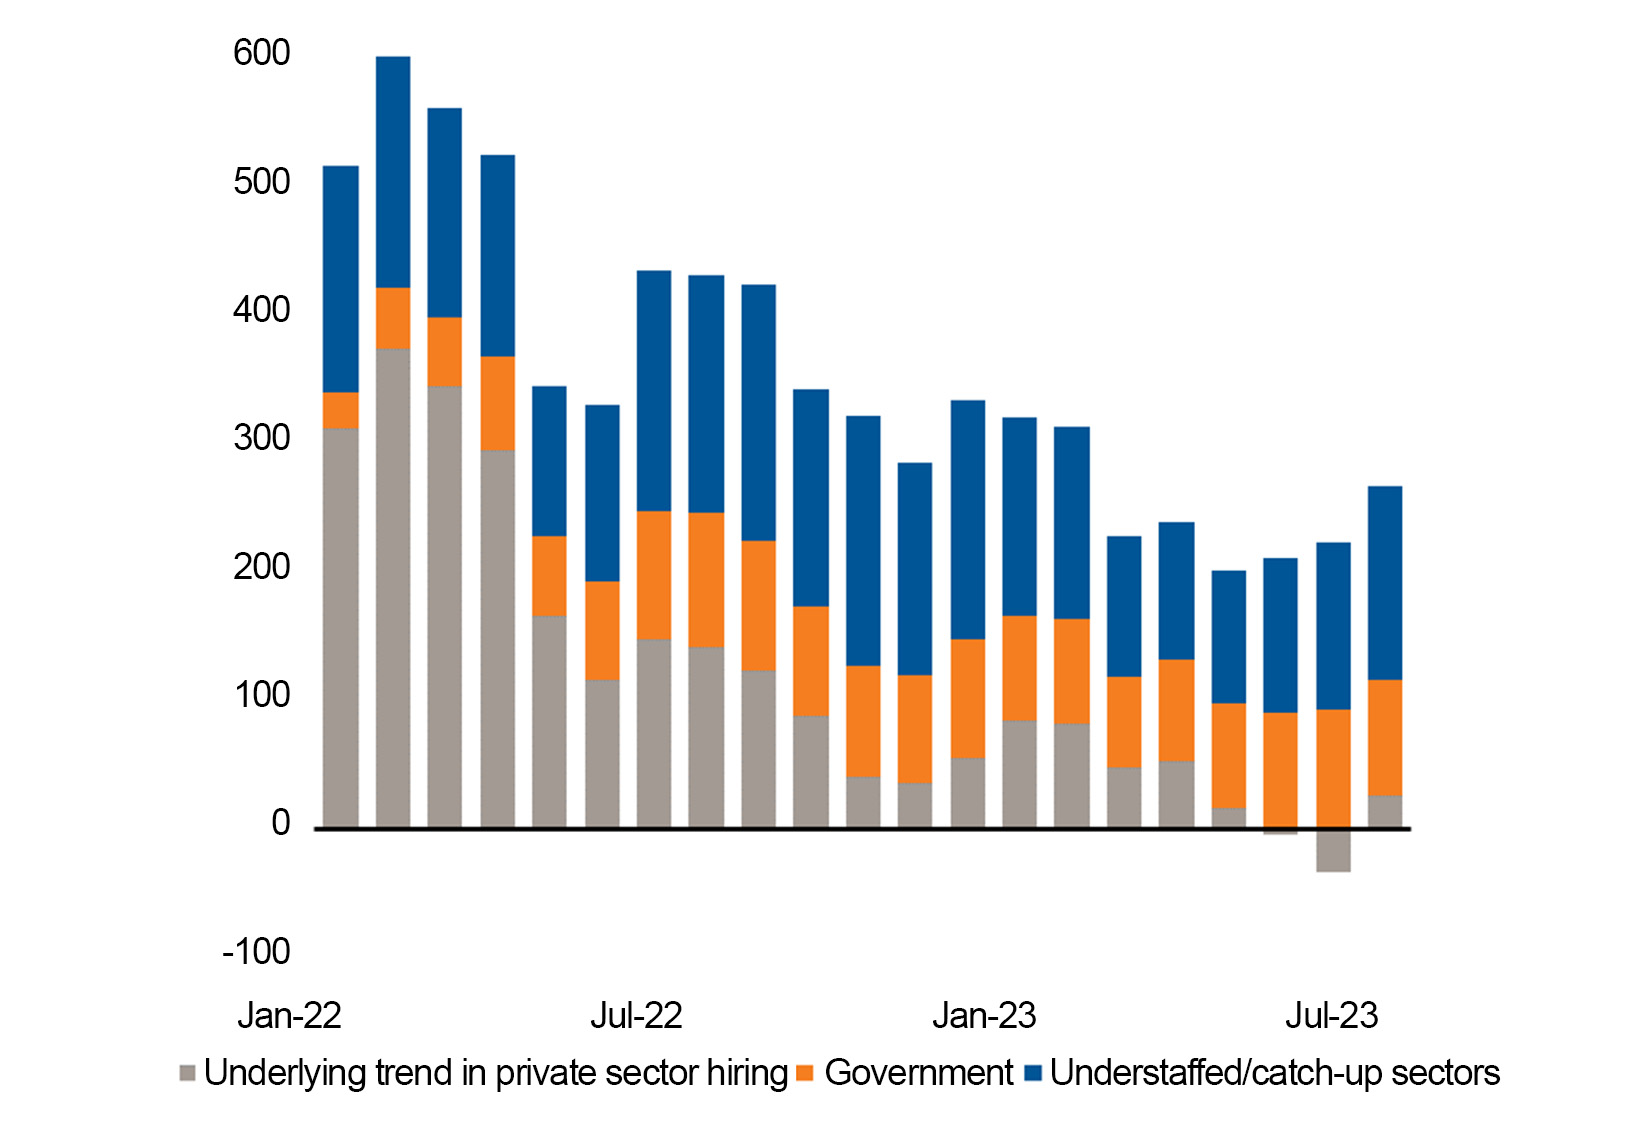
Source: LSEG Datastream, BLS, BEA, Board of Governors of the Federal Reserve System, Russell Investments. Based on available data as of October 6th, 2023. "Understaffed" sectors in the left chart include "Leisure and Hospitality" and "Education and Health Services". These sectors were amongst the most impacted by COVID-19 and have been the last to catch up to 2019 staffing levels.
Our Chief Investment Strategist once described the jobs reports as "the king of economic data." It has undoubtedly been a key focal point. Although the sharp post-COVID economic recovery was initially a welcome blessing for the markets, it eventually created an imbalanced labor market.
One key method of looking at the labor market is to examine the pace of monthly job creation. The chart above shows a decomposition of the trailing three-month average job creation in the U.S.
The chart shows us that the monthly pace of job creation has fallen quite noticeably from its peak, although it remains above 77,500 jobs per month – the Atlanta Fed's estimate of the pace of monthly job creation needed to attain the 4% NAIRU in 12 months.
While there is still some resilience in the job creation numbers today, it's important to note that the bulk of hiring activity now appears to be driven by "catch-up" employment from sectors still operating below their pre-pandemic levels. Once these sectors have caught up, the overall pace of hiring will likely slow even more.
The quits rate continues to be somewhat above its prepandemic average, suggesting that the labor market is still somewhat overheated. As the labor market continues softening, we would likely see the quits rate continue to decline over time.
The Labor Market is Overheated
(Click image to enlarge)
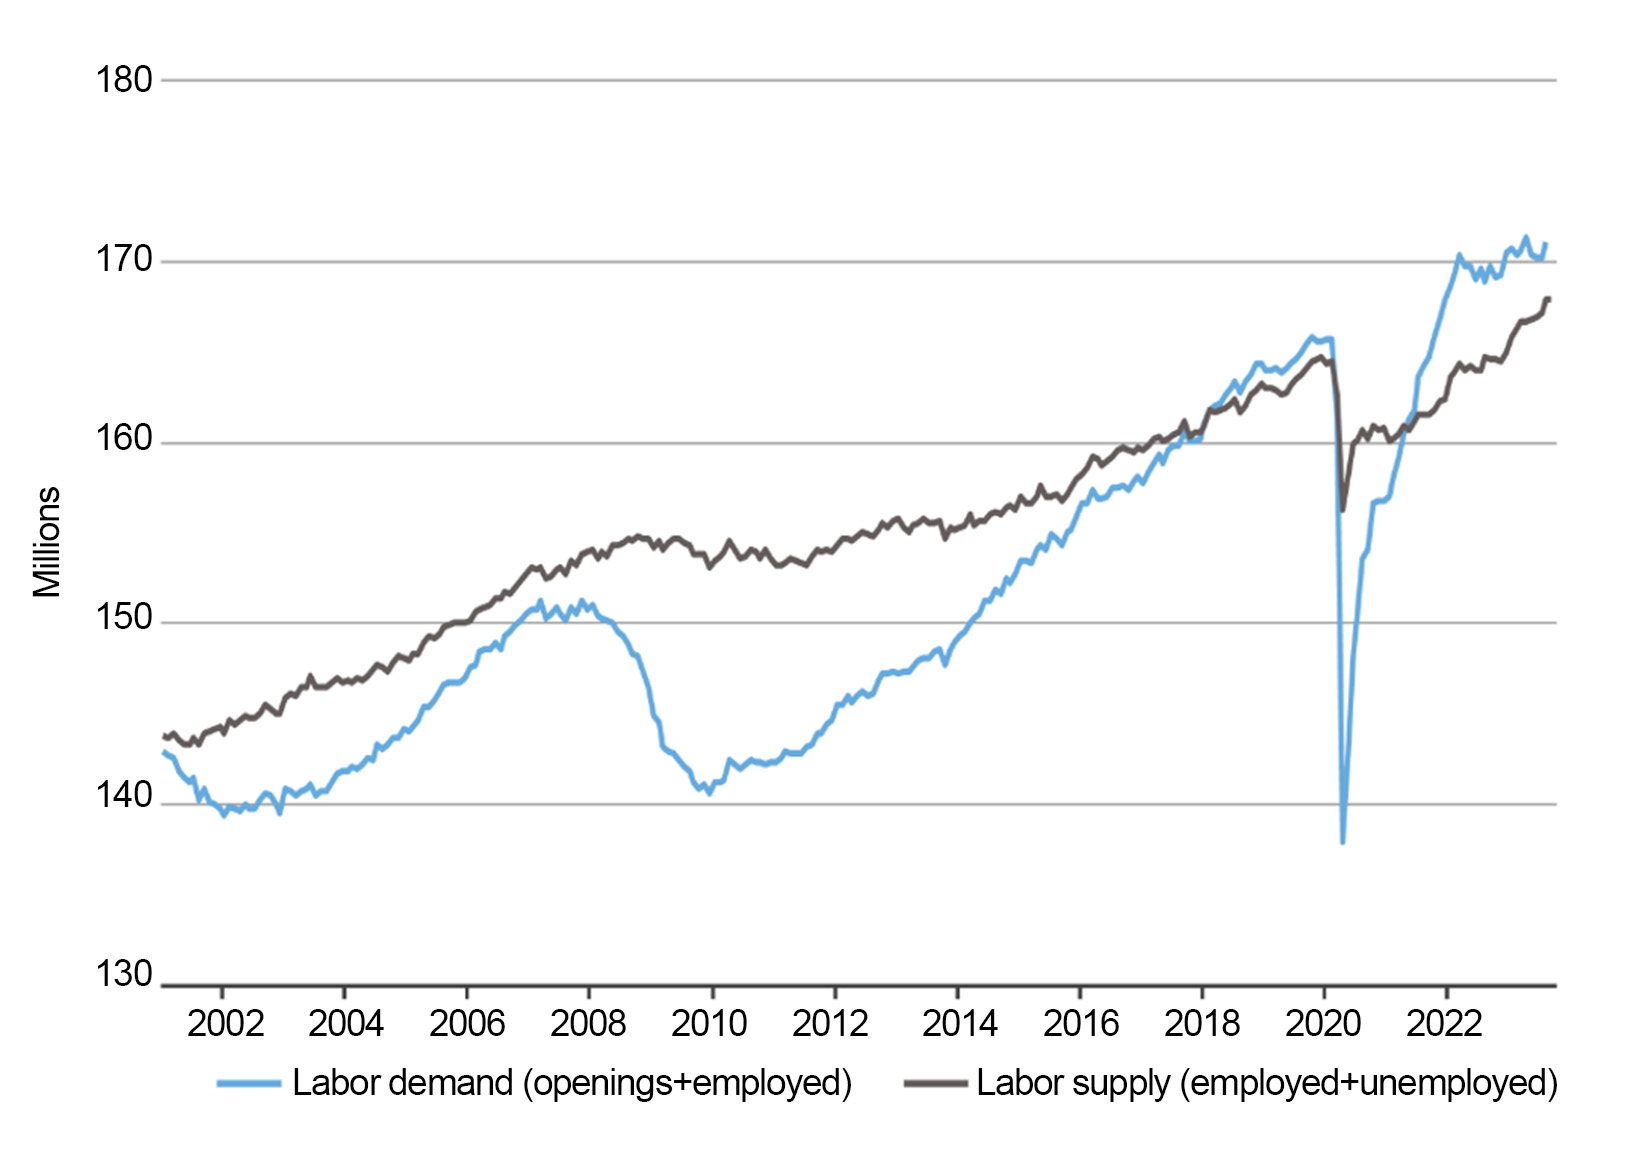
Source: Russell Investments’ calculations using data from LSEG datastream through August 2023.
The long-run prepandemic experience shows that labor demand is usually somewhat less than labor supply. However, post-pandemic, an imbalanced labor market caused labor demand to exceed labor supply. While that gap has narrowed, it remains quite visible.