Municipal bonds – How could they react if the U.S. economy slows down?
When we last wrote about municipal bonds, we noted that within the broader fixed income opportunity set, we considered tax-exempt municipals to be more attractive than their taxable bond counterparts, due in part to their solid fundamental profile. So far this year that premise has proven to be the case: Despite the recent interest rate volatility driven by the U.S. Federal Reserve (Fed) and other central banks like the Bank of England, municipals have managed to do better than taxable bonds, outperforming by +3.16% as of Sept. 27, 2022. This means municipals have also outperformed equities (as measured by the S&P 500 Index) by 8.98% over the same period. At this point we want to take a look at how municipals might fare should the U.S. economy begin to slow.
What may drive an economic slowdown? Aggressive Fed tightening
In a largely consensus move at its most recent meeting in September, the Fed raised interest rates by 0.75% to bring the federal funds range to 3.0%-3.25%. While the market had been largely anticipating a more hawkish tone after August’s inflation report and the Jackson Hole speech, it was caught off-guard by the Fed’s downgraded economic projections and upwardly revised dot-plot (i.e., expected interest-rate hiking path). Compared to the June meeting, the median 2022 projected Fed funds rate (based on surveys of Fed officials) increased to 4.4% from 3.4% and for 2023 increased to 4.6% from 3.8%. These are big moves.
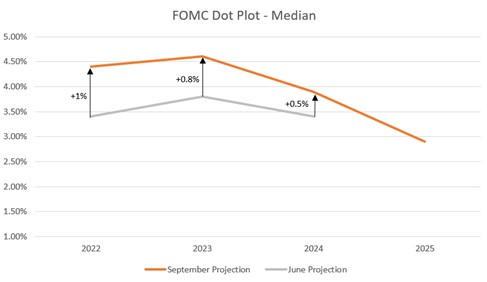
Source: Summary of Economic Projects
Municipal tax revenue strength tends to continue into the start of a recession
It’s not news that tax revenues of states and localities have been doing well following the 2020 pandemic lockdown and recession. Strong labor markets with higher wages along with surging inflation have fed into higher personal income and sale tax revenues. But how will tax revenues behave as we approach a potential recession? While it’s logical to think tax revenues will go down heading into a recession, historically tax revenues decline well after a recession has started, seen in the chart below following the 2007 recession.
Quarterly state & local tax revenues (1Q2000 through 2Q2022)

Source: https://www.census.gov/
Municipals have superior credit quality
Fundamental credit strength is a risk factor that investors should consider when deciding on what parts of the fixed income market to invest in—particularly if they are concerned about an economic downturn that might drive up defaults. The table below showing historic default rates demonstrates municipals’ superior quality: For BBB-rated bonds (the lowest rung of investment grade and where many investment managers hunt for value), municipals have the same default rate as AAA-rated corporates. For the entire investment grade quality cohort, the corporate default rate has been 14x that of municipals, and within (lower quality) high yield the corporate default rate has been 3x that of municipals—demonstrating municipals’ history of relatively strong credit quality.
Default rates: Municipals versus corporates
| Credit rating | Municipal default (%) | Corporate default (%) |
| AAA | 0.00 | 1.14 |
| AA | 0.05 | 1.40 |
| A | 0.14 | 2.63 |
| BBB | 0.98 | 5.78 |
| BB | 4.49 | 17.87 |
| B | 10.97 | 30.56 |
| CCC/C | 39.59 | 60.22 |
| Investment grade | 0.25 | 3.53 |
| Sub-investment grade (high yield) | 8.59 | 27.46 |
Source: Standard & Poor’s, 1/1/86 – 1/1/21 (Municipals) and 1/1/81 – 1/1/21 (Corporates). The calculation represents a 15-year cumulative default rate.
Municipals’ superior tax-adjusted yield
Municipals typically have a lower nominal yield than taxable bonds due to their federally tax-exempt nature. Thus it’s important to adjust their yields to make them comparable to their taxable counterparts. We can see in the table below, assuming a 35% personal income tax rate, that municipals have a much more attractive yield. It’s also worth noting that municipals also have a longer duration, and thus are more sensitive to changes in interest rates. However, when adjusting for duration, municipals’ taxable equivalent yield is still superior.
Yields and duration: Municipals versus taxable bonds
| Yield and duration | Municipal bonds | Taxable bonds |
| Yield (%) | 4.03 | 4.86 |
| Yield - Taxable equivalent* (%) | 6.20 | 4.86 |
| Duration (years) | 7.13 | 6.18 |
| Yield / duration | 0.87 | 0.79 |
Source: Bloomberg, 9/27/22. The Bloomberg Aggregate Bond Index represents Taxable Bonds, and the Bloomberg Municipal Bond Index represents Municipal Bonds. * Yield - Taxable Equivalent is based on a 35% personal income tax rate.