Why we believe bonds are back—especially munis
Nowhere to hide
The recent market selloff has left investors with few places to hide, with substantial downside moves rippling across most asset classes. As of May 20, 2022, the S&P 500 Index and the NASDAQ Composite are down 18% and 27% on the year, respectively. U.S. Treasuries, often seen as safe-haven assets and negatively correlated with equities, have also experienced pain, with the benchmark 10-year note down 8% year-to-date, with its yield doubling from 1.5% to 3.0%.
A rapid increase in the level of interest rates in the face of rising inflation and a hawkish Federal Reserve (Fed) has challenged the historical correlations between bonds and equities. However, recently we have seen some indications that the traditional relationship between bonds and stocks is returning as elevated bond yields appear attractive.
As seen in Chart 1 below, over the past two decades, fixed income served as a strong diversifier in times of equity drawdowns. For example, during and after the dot-com bubble (2000-2002) and housing crisis (2008), the Bloomberg U.S. Aggregate Index provided positive total returns, serving as a ballast to negative equity returns. However, this was not the case during the first four months of the year, with the Bloomberg Agg following the S&P 500 into the red amid spiking interest rates.
Chart 1

2022 data is YTD as of May 20, 2022
Rates and equity-bond correlation find footing
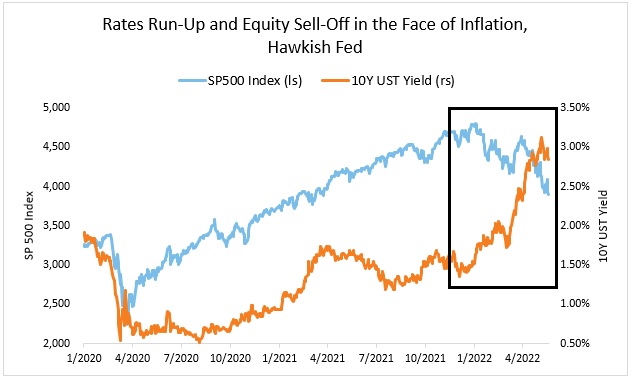
The Treasury yield curve has seen a considerable shift up since the beginning of the year. Case-in-point: the 10-year yield jumped from 1.5% to over 3% at one point (see Chart 2), while the 2-year yield had an even larger move, rising from 0.75% to a peak of 2.78%. These moves have been primarily driven by elevated inflation that has yet to be tamed, the Russia-Ukraine conflict (which has led to a surge in energy prices) and COVID-19 shutdowns in China (which are contributing negatively to an already-constrained supply chain).
Central banks have reacted to these developments with rate hikes and tighter policies, with the Fed’s expected neutral rate for the end of 2022 now at 2.8%, up from 1.9% at the beginning of the year.1
Chart 2
Source: S&P, U.S. Department of Treasury. Data as of 5/20/2022.
Bond yields looking attractive
Today, the 10-year Treasury note is trading in line with the Fed’s expected neutral rate, and there are signs traditional bond-equity correlations are returning. For instance, over the past month, the Bloomberg U.S. Agg has remained flat while equities continue their downward trajectory. Ultimately, in our view, yields look much more attractive than a few months ago. Last week’s 20-year Treasury auction is a positive example, signaling strong demand for Treasuries. The auction was well covered, and 20-year bonds priced at 3.290%, less than the pre-auction level of 3.292%.
As shown in Chart 1 above, bonds have historically proven their worth during recessionary periods. As recessionary pressures and the cost-of-living squeeze increase in Europe and the U.S., investors are finding their way back into safe-haven assets. Bonds may continue to be an equity counterweight as market data points are reported in June, largely the consumer price index (CPI) print and any Federal Reserve rhetoric accompanying its expected 50 basis-point (bp) policy rate hike.
Municipals looking especially attractive
Tax-adjusted municipal bond yields look attractive when compared to taxable yields. For example, the Bloomberg 1-15 Year Municipal Blend Index (1-17)’s yield-to-worst was 3.10% on May 20, 2022, or 4.56% adjusted for a 32% tax rate. Compare that to the Bloomberg Aggregate Bond Index, which yields 3.42%. Additionally, the Bloomberg 1-15 Year Municipal Blend Index (1-17) ’s duration is 4.6 years versus the Aggregate’s duration of 6.5. In short, municipals provide more attractive yield with less duration (i.e., interest rate sensitivity).
The bottom line
Due in large part to their now higher nominal yields, bonds broadly appear to be reasserting themselves as a risk ballast in multi-asset portfolios. Within the broader fixed income opportunity set, a shorter duration profile amid the current volatile rate regime, coupled with strong state and government balance sheets, leads us to see municipals as an attractive opportunity versus their taxable counterparts. We’ll continue to closely monitor the latest developments in fixed income markets as the situation evolves.
¹ Federal Reserve Economic Data (FRED) Neutral Rate: https://fred.stlouisfed.org/series/FEDTARMD#0