Are taxable accounts sitting between a rock and a hard place?
We’ve all heard the saying caught between a rock and a hard place, which by definition means that when you’re in a difficult situation you may have to choose between two equally unpleasant courses of action.
This makes me think about being between the rock of rebalancing a portfolio back to target allocations and the hard place of doing so, which triggers a tax bill in a taxable account … especially with any style-specific products that fit into the Morningstar style boxes.
What do I mean by this?
- We’ve seen a significant rotation between growth and value stocks over the last few quarters. As the saying goes: “history doesn’t repeat itself, but it does rhyme.”
- Rebalancing between growth and value, U.S. and non-U.S., or equity and fixed income is one of the easiest things to talk about but is one of the hardest things to do.
- Individual investors don’t often rebalance on their own—because who wants to sell what’s made them happier and wealthier in order to buy what’s frustrated them and underperformed?
We’ve been talking about our Value of an Advisor study since 2013. It is STILL one of the most requested value-added pieces that we share with our advisor partners. One of the many components of advisor value is active portfolio rebalancing. This has been top of mind currently, given how variable returns have been between investment styles such as growth and value, but it may be difficult to broach the subject with clients who let the tax tail wag the overall investment portfolio. Rebalancing in a taxable account will require selling your winners (and paying taxes) to bring a portfolio back to the target allocation.
It’s possible the Morningstar style boxes are impeding portfolio rebalancing within taxable accounts. To see why I believe this may be the case, we’ll look at two different portfolios over the past two decades.
Let’s start with an investment of $1 million on January 1, 2000. This investment portfolio is very focused on the Morningstar style boxes:
- 35% to U.S. large cap growth – defined by the S&P500 Growth Index (or, you can choose your favorite actively managed large cap growth mutual fund)
- 35% to U.S. large cap value – defined by the S&P500 Value Index (or, you can choose your favorite actively managed large cap value mutual fund)
- 15% to U.S. small cap growth – defined by the Russell 2500 Growth Index (or, you can choose your favorite actively managed small cap growth mutual fund)
- 15% to U.S. small cap value – defined by the Russell 2500 Value Index (or, you can choose your favorite actively managed small cap value mutual fund)
If you have read the novel The Tale of Two Cities (as I did in high school), the last two decades have been the ‘best of times’ for value (relative to growth) and the ‘worst of times’ for value relative to growth.
First, let’s look at the years 2000-2010, in which value stocks outperformed. Then we’ll look at the years 2010-2020, in which growth stocks outperformed.
The target weight is the initial portfolio allocation at the start of each decade. The maximum and minimum weights show the highest and lowest allocation during the period, and the ending weight is how the portfolio looked at the end of each decade.
1/1/2000 - 12/31/2009
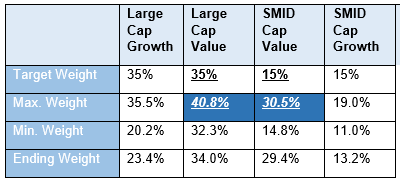
Source: Russell Investments, Morningstar. Indexes are unmanaged and cannot be invested in directly. Past performance is not indicative of future performance.
Let’s compare the starting weight for small & mid-cap (SMID) value and the maximum weight in that decade. Those numbers are stunning. Can you imagine an investor actually selling their value stocks and paying taxes on the gains to go back to their policy weights in that kind of environment?
But now let’s look at how value stocks fared in the growth-led 10-plus years that followed.
1/1/2010-3/31/2021
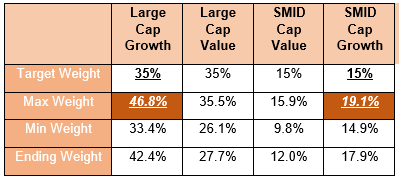
Source: Russell Investments, Morningstar. Indexes are unmanaged and cannot be invested in directly. Past performance is not indicative of future performance.
Again, would that investor be proactive enough to sell their winners (paying taxes to do so), to bring things back to policy for the next decade? And, as we have noted earlier, the easing of the COVID-19 pandemic is leading to a reopening trade that appears to be a good news story for value. It’s possible that it’s value’s turn to take leadership again.
This is that rock (rebalancing) and hard place (paying taxes) that I’m seeing lately. Both seemingly equally unpleasant courses of action facing investors.
Where the rubber meets the road and how we can help
The numbers above confirm our belief in the importance of working with an advisor, who can act as a behavior coach and ensure a portfolio is actively rebalanced so that it remains within the target allocations originally determined. After all, those allocations were chosen with the investor’s goals, needs and circumstances in mind.
Now let’s look at what happens when we annually rebalance these four style-box investments back to plan on Jan. 1 of each year AND pay the necessary taxes to do so. We’ll assume the client pays 15% long-term capital gains rates annually (it could be higher in some cases).
Annually rebalancing those four style indices 21 times (back to 2000), resulted in a $71,675 tax bill. That’s a lot for an investor to willingly swallow! Talk about a rock and a hard place.
Now let’s see what happens when we rebalance a style neutral portfolio using a 70% S&P500 Index /30% Russell 2500 Index blend. Again, we are rebalancing back to target each year between 2000 and 2020.
That gives us a tax-bill of only $23,484.
Now, you could rebalance with cash flow at the account level, BUT, what if your client isn’t adding to the account? There would be no cash flow to utilize for rebalancing purposes.
As you can see, taxable accounts can often be sitting between that ROCK (rebalancing) and the HARD PLACE (selling style specific products and paying taxes to do so).
How we can help
Russell Investments’ tax-managed active equity mutual fund products are multi-style products (which means they include both growth and value stocks) and are sub-advised by multiple underlying money managers all within one ticker symbol. Additionally, we automate tax-loss harvesting within the funds and actively rebalance between styles and across underlying managers using cash flow from our entire advisor/investor base, NOT just the individual account.
Here’s a high-level example of our Tax-Managed U.S. Mid & Small Cap Fund, which contains various investment styles and capitalization sizes, as well as multiple underlying money managers:
Click image to enlarge
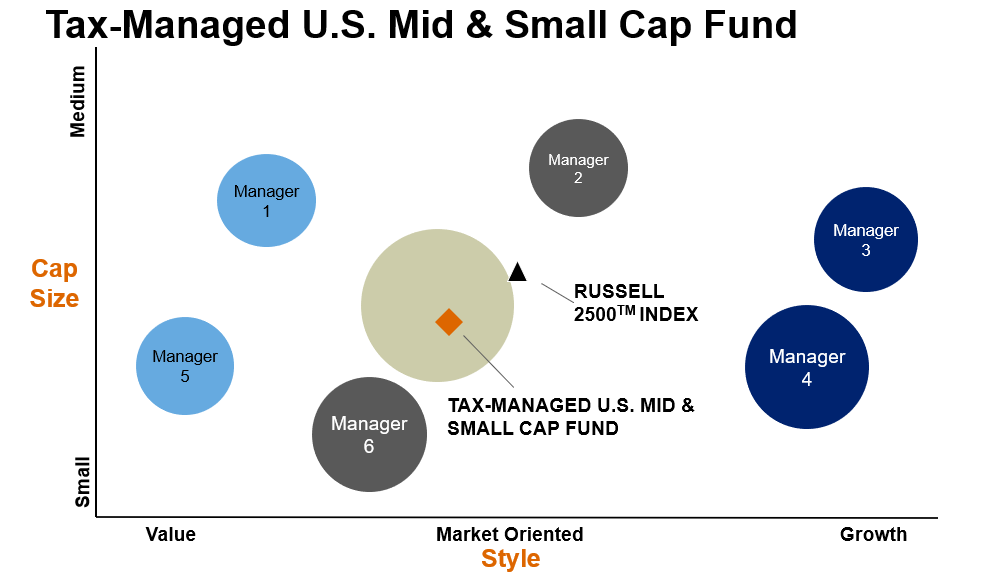
Hypothetical illustration. Not intended to depict any Russell Investments fund nor any specific investment. This mosaic depicts, at a specific point in time, the approximate relative weighting of managers and strategies within a hypothetical Fund, plotted on the basis of cap size and style against fund benchmark (▲). Positions on this mosaic change over time as allocations and holdings change. The circle size represents the relative size of each allocation in the Fund. The money managers do not guarantee the performance of any Fund or any particular rate of return.
How you can show your clients the tax impact of investment products
Last year, Russell Investments introduced the Tax Impact Comparison Tool. It allows you to plug in different investments and see how taxes impact their returns. Give it a try. And, when you do, you will be able to see the difference between pre-tax and after-tax return. Also, bear in mind those data points for the Russell Investments’ tax-managed strategies include ALL of the many things we do to avoid being between that rock and hard place.
The bottom line
Albert Einstein once said, “the hardest thing to understand in the world is the income tax.” I think that reconstructing a client’s after-tax return incorporating ALL of the fund changes, rebalancing trades and so on might be a close second. We believe that knowledge is power. Our Tax Impact Comparison Tool helps advisors to make informed decisions about the tax impact of investments.
As you are reviewing investment portfolios this year, reach out to your regional Russell Investments representative to guide you through our tool or to help you understand the potential benefits of tax management for your client portfolios. Making the evaluation of tax-managed investing easier can help these discussions be more compelling.