Three tax-management charts every advisor should study in 2018
 We work with many advisors who are ramping up the number of conversations with their clients and prospects about tax-smart investing. Charts and insights can make those discussions compelling.
We also recently updated our After-Tax Wealth Advisor Handbook for 2018. We’re calling it the Tax Reform Edition. We partnered with Deloitte to offer expert-level insight on the tax changes themselves, along with actionable tax-planning tactics for advisors. Aside from the updates, the handbook also offers expert insight into tax-smart investing, leveraging our 30 years of experience.
I want to personally share three charts from the Handbook that caught my attention. These charts are particularly relevant to the tax landscape of 2018. I believe advisors who care about taxes should take a few minutes to understand them.
We work with many advisors who are ramping up the number of conversations with their clients and prospects about tax-smart investing. Charts and insights can make those discussions compelling.
We also recently updated our After-Tax Wealth Advisor Handbook for 2018. We’re calling it the Tax Reform Edition. We partnered with Deloitte to offer expert-level insight on the tax changes themselves, along with actionable tax-planning tactics for advisors. Aside from the updates, the handbook also offers expert insight into tax-smart investing, leveraging our 30 years of experience.
I want to personally share three charts from the Handbook that caught my attention. These charts are particularly relevant to the tax landscape of 2018. I believe advisors who care about taxes should take a few minutes to understand them.
1. Despite tax reform, tax-smart investing still matters.
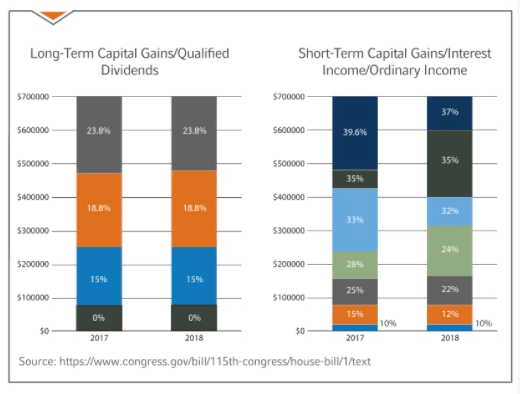 On December 22, 2017, President Trump signed the Tax Cuts and Jobs Act (TCJA) into law. The tax-reform legislation is formally titled “An Act to provide for reconciliation pursuant to titles II and V of the concurrent resolution on the budget for fiscal year 2018.”
Headlines focused on the reduction of the federal taxable income thresholds and the generally lower tax rates. But let’s be clear: These lower tax rates applied to taxable income, short-term capital gains and non-qualified dividends. One aspect tends to be glossed over: Tax rates on long-term capital gains and qualified dividends did not change.
Sure, the taxable thresholds for these investment gains changed modestly, but not by much, especially when compared to the revisions for taxable income. And, as you can see in the charts above, the rates themselves didn’t budge.
Think back to 2017, when capital markets posted some of their strongest returns in recent history. At the same time, many mutual funds had significant taxable distributions. That means capital gains tax came into play and many investors didn’t get to keep as much of their portfolio returns as they may have earned.
The average capital gain distribution for those U.S. equity mutual funds and ETFs that had a distribution was 8.4% of the fund’s Net Asset Value. Compare that to 2016, when the average was 5.6%.1 This distribution was split, on average, between 20% short-term capital gains and 80% long-term Capital Gains—which was also higher than 2016, when the proportion of short-term to long-term capital gains was 11% to 89%, respectively. Remember, federally short-term capital gains are typically taxed at a higher rate, compared to long-term capital gains.
It’s easy to get lost in all the percentages. Just realize that for investor clients, this represents real money sacrificed to taxes.
On December 22, 2017, President Trump signed the Tax Cuts and Jobs Act (TCJA) into law. The tax-reform legislation is formally titled “An Act to provide for reconciliation pursuant to titles II and V of the concurrent resolution on the budget for fiscal year 2018.”
Headlines focused on the reduction of the federal taxable income thresholds and the generally lower tax rates. But let’s be clear: These lower tax rates applied to taxable income, short-term capital gains and non-qualified dividends. One aspect tends to be glossed over: Tax rates on long-term capital gains and qualified dividends did not change.
Sure, the taxable thresholds for these investment gains changed modestly, but not by much, especially when compared to the revisions for taxable income. And, as you can see in the charts above, the rates themselves didn’t budge.
Think back to 2017, when capital markets posted some of their strongest returns in recent history. At the same time, many mutual funds had significant taxable distributions. That means capital gains tax came into play and many investors didn’t get to keep as much of their portfolio returns as they may have earned.
The average capital gain distribution for those U.S. equity mutual funds and ETFs that had a distribution was 8.4% of the fund’s Net Asset Value. Compare that to 2016, when the average was 5.6%.1 This distribution was split, on average, between 20% short-term capital gains and 80% long-term Capital Gains—which was also higher than 2016, when the proportion of short-term to long-term capital gains was 11% to 89%, respectively. Remember, federally short-term capital gains are typically taxed at a higher rate, compared to long-term capital gains.
It’s easy to get lost in all the percentages. Just realize that for investor clients, this represents real money sacrificed to taxes.
2. Investment taxes can be a factor in low and high-return years.
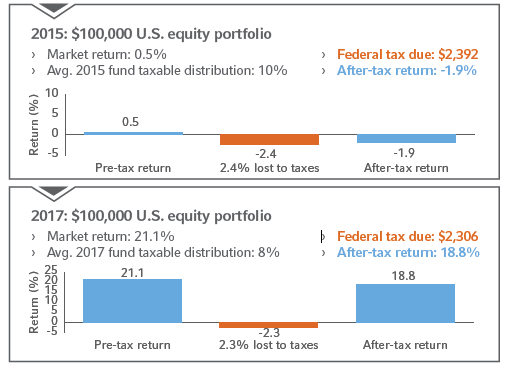 Market Return: Russell 3000. Index. Average Taxable Distribution includes average capital gain distribution for all Morningstar U.S. equity categories for listed year (no ETFs). Distribution is assumed to be made at last day of year and reinvested. Assumed federal tax rate is 23.8% (Max LT Cap Gain 20% + Net Investment Income 3.8%). Percent lost to taxes is the estimated taxes due divided by $100k. This example does not reflect the deduction of state income taxes. If it had, returns would have been lower. Index returns represent past performance, are not a guarantee of future performance, and are not indicative of any specific investment. Indexes are unmanaged and cannot be invested in directly.
2017 was an up-market year, so of course taxes were a factor. But what about 2018? If the first half of the year is any indication, returns will be much flatter. So then, are taxes still a factor?
This chart shows how taxes can also impact investor returns in lower-return environments. When comparing 2015 and 2017, you’ll see that the tax burden was similar in both years. The power of tax-managed investing lies in dialing down tax drag in all market conditions—up, down and flat. As an advisor, if you were able to reduce the tax bill in 2015 to $392, that would have been an extra $2,000 in the investment account. Successful tax-managed investing could allow this $2,000 to potentially grow and compound over time in the client’s account. While the return was higher in 2017, the tax bill is similar in both years. For taxes, remember it is not about the return of the investment, but the amount of capital gain and dividends that are distributed. Reducing the tax liability is important, regardless of return. This is how tax-smart advisors can materially improve the odds of success for tax-sensitive clients.
Market Return: Russell 3000. Index. Average Taxable Distribution includes average capital gain distribution for all Morningstar U.S. equity categories for listed year (no ETFs). Distribution is assumed to be made at last day of year and reinvested. Assumed federal tax rate is 23.8% (Max LT Cap Gain 20% + Net Investment Income 3.8%). Percent lost to taxes is the estimated taxes due divided by $100k. This example does not reflect the deduction of state income taxes. If it had, returns would have been lower. Index returns represent past performance, are not a guarantee of future performance, and are not indicative of any specific investment. Indexes are unmanaged and cannot be invested in directly.
2017 was an up-market year, so of course taxes were a factor. But what about 2018? If the first half of the year is any indication, returns will be much flatter. So then, are taxes still a factor?
This chart shows how taxes can also impact investor returns in lower-return environments. When comparing 2015 and 2017, you’ll see that the tax burden was similar in both years. The power of tax-managed investing lies in dialing down tax drag in all market conditions—up, down and flat. As an advisor, if you were able to reduce the tax bill in 2015 to $392, that would have been an extra $2,000 in the investment account. Successful tax-managed investing could allow this $2,000 to potentially grow and compound over time in the client’s account. While the return was higher in 2017, the tax bill is similar in both years. For taxes, remember it is not about the return of the investment, but the amount of capital gain and dividends that are distributed. Reducing the tax liability is important, regardless of return. This is how tax-smart advisors can materially improve the odds of success for tax-sensitive clients.
3. The potential impact of taxes on client portfolios
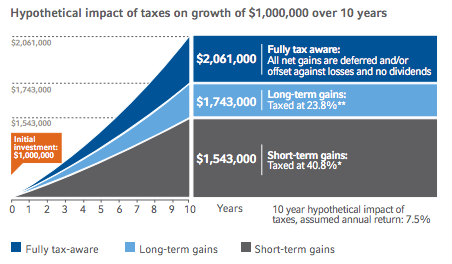 * 40.8% tax rate: Top assumed federal marginal rate of 37.0% + 3.8% net investment income tax. ** LT Cap Gain rate of 20% + 3.8% Net investment income tax. This example does not reflect the deduction of state income taxes. If it had, returns would have been lower. This is a hypothetical illustration and not meant to represent an actual investment strategy. Taxes may be due at some point in the future and tax rates may be different when they are.
Take a look at the chart above and see the material range of possible outcomes focusing on a tax-smart approach could have for your tax-sensitive clients. Whether they are investing for short-term or long-term gains, a failure to take a tax-aware approach can significantly put their financial security at risk.
At the same time, taking a tax-smart approach can be a potential growth tool for advisors. Those who offer tax-smart expertise can be differentiated as clear value providers. Tax-sensitive clients are likely to appreciate the care you put into helping them keep as much of their returns as possible.
One more thought: For advisors, the approach can help uncover hidden assets— those assets your client may have declined to disclose to you—and potentially increase your key clients’ loyalty to you, helping you grow your business in the areas where you can add the most value.
* 40.8% tax rate: Top assumed federal marginal rate of 37.0% + 3.8% net investment income tax. ** LT Cap Gain rate of 20% + 3.8% Net investment income tax. This example does not reflect the deduction of state income taxes. If it had, returns would have been lower. This is a hypothetical illustration and not meant to represent an actual investment strategy. Taxes may be due at some point in the future and tax rates may be different when they are.
Take a look at the chart above and see the material range of possible outcomes focusing on a tax-smart approach could have for your tax-sensitive clients. Whether they are investing for short-term or long-term gains, a failure to take a tax-aware approach can significantly put their financial security at risk.
At the same time, taking a tax-smart approach can be a potential growth tool for advisors. Those who offer tax-smart expertise can be differentiated as clear value providers. Tax-sensitive clients are likely to appreciate the care you put into helping them keep as much of their returns as possible.
One more thought: For advisors, the approach can help uncover hidden assets— those assets your client may have declined to disclose to you—and potentially increase your key clients’ loyalty to you, helping you grow your business in the areas where you can add the most value.
The bottom line
So, don’t shy away from tax-sensitive clients in 2018. Tax-smart investing still applies. Maybe more than ever.1Source: Morningstar and Russell Investments calculations. Includes all open-ended U.S. equity mutual funds and ETF’s to include active and passive funds, and all share classes, in the Morningstar U.S. Fund Large Blend, U.S. Fund Large Growth, U.S. Fund Large Value, U.S. Fund Mid-Cap Blend, U.S. Fund Mid-Cap Growth, U.S. Fund Mid-Cap. Investment taxes can be a factor in low and high-return years.