What you know won’t hurt you
Writing this note on Monday morning in Seattle, the MSCI All Country World Index is sitting a percent above Friday’s close. Developments over the weekend did not dramatically change the market landscape.
Most developed markets are still enforcing strict containment measures. There are some green shoots that those efforts may be starting to slow net new infections in Italy and other European countries. Governments continue to plow money into their local economies to provide income support to impacted households and businesses. Across the Pacific, Australia announced a wage subsidy measure —valued at roughly 6.5% of GDP (gross domestic product)—for companies that have sharp revenue declines but keep their workforce employed. China’s Politburo also talked about the need for further fiscal and monetary stimulus to achieve economic stability.
Release of March economic data begins Wednesday
This Wednesday marks the start of April, and with that the start of the reporting season for March economic data. We know entire industries were shuttered in the United States and Europe in March. And some of the timeliest data around global manufacturing and the U.S. labor market point to an unprecedentedly sharp slowdown. Today’s special topic is a closer look at just how horrible those March numbers are likely to look.
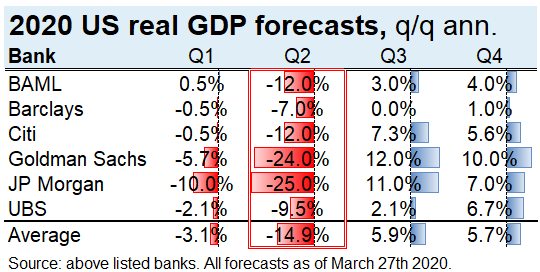
The good news is that this historic slowdown, and likely recession, is well-known and already embedded in the consensus. The table below shows that the U.S. economy in the second quarter is estimated to contract at a 15% annualized rate. Note: the worst quarter since official records began in 1947 was -10% (Q1 1958). The numbers for the eurozone look equally bad.
Click image to expand
We believe that markets should expect record-breaking declines in many data points in the weeks ahead. Here are a few examples:
- Many economists knew about the potential for a massive spike in U.S. initial jobless claims last week. At 3.3 million new claims, the data spiked not just to an all-time high, but a level roughly five times the peak from 2008-2009. If this is plotted on a chart, it, quite simply, looks ridiculous. Yet we know that a large part of this spike is due to the fact that many businesses have had to close their doors recently due to strict government containment efforts. All else equal, this one week of unemployment flows would likely push the U.S. unemployment rate up to around 5.5%.
We expect another ugly initial jobless claims report this week, as containment measures remain severe and some big states like California and New York may have underreported the true extent of damage, as their unemployment offices could not keep up with the number of new filings. We believe it wouldn’t be surprising for the U.S. unemployment rate to jump to 10% (or higher) in the next couple of months.
- The U.S. employment report for March is likely to show a sharp slowing in net new payrolls. That being said, it likely won’t show the full extent of damage. Why? The Bureau of Labor Statistics’ Establishment Survey was conducted the week before jobless claims jumped up. The timing of the survey and a temporary boost from Census hiring could keep this Friday’s payrolls tally at right around zero.
While there’s truckloads of uncertainty around this number, our main point is we already know it will get worse. Most investors will likely judge the employment report to be stale before it comes out. The unemployment rate is moving higher and we’ll likely see that much more clearly next month.
- We also track purchasing manager indices for a timely read on global activity levels. Preliminary data for March has already been released for the United States, the eurozone, the United Kingdom, Japan and Australia. Every region showed a dramatic slowdown in March, particularly in the services sector, which has been hard-hit by government containment efforts. For context, these indices are constructed such that a value of 50 is the breakpoint between expansion and contraction. The output and new orders subcomponents of this indicator appear to have cratered to a level of 36 for the developed markets. For perspective, the bottom in 2008 was around 35.
Expect more dismal numbers this week as the rest of the developed and emerging economies report. Bottom line: these indicators suggest global activity levels are (much) weaker than a month ago—something that markets should already know.
April will be ugly. But it shouldn’t come as a surprise.
In short, April is going to be ugly. Yet it’s important to understand that while the actual experience could, of course, turn out to be better or worse than economists currently anticipate, a lot of damage is already in the price. Put another way, the market is expecting things to be ugly for a while. We already saw some evidence of this last Thursday, with the almost five-fold increase on the existing weekly record of jobless claims. Markets were largely unaffected, and most actually ended the day slightly up.
We could go on. But the point is that we are going to be peppered with worst-ever headlines for weeks or months on end. Now is an important time to stay disciplined and focus on long-term investment plans. As the numbers roll in, ask yourself if the data is telling you something you don’t already know. We all know that the global economy has been damaged by the containment efforts from the coronavirus, and that markets have sold off to reflect that damage. Being prepared for bad news can help us avoid making behavioral mistakes when those around us are panicked.