Capital gains: When being below average is a good thing
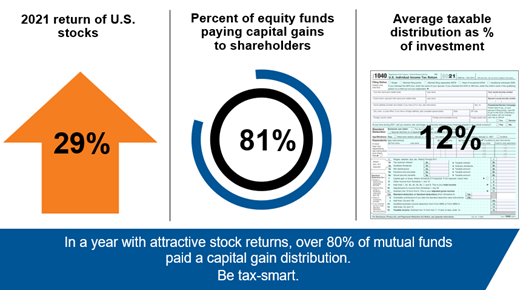
From 2008 onward, U.S. market returns have been strong and consistent, and 2021 was no different, with the S&P 500 returning a solid 29%. There should be nothing to complain about, right? That’s a true statement until the 2022 tax season takes a bite out of your gains.
In 2021, 81% of U.S. equity funds made a capital gain distribution and, on average, that distribution was 12% of NAV (net asset value). Since a distribution is a taxable event, your non-qualified investments will likely generate a larger tax bill than you may be used to seeing.
Click image to enlarge
Source: Russell Investments and Morningstar Direct: U.S. Stocks Returns = S&P 500 Index; U.S. equity funds: Morningstar broad category ‘US Equity’ (large/mid/small V/B/G) which includes mutual funds and ETFs (and multiple share classes). Average U.S. equity fund Distribution: Capital Gains/Share (% of NAV) based on Morningstar U.S. OE Mutual Funds and ETFs. % = total cap gain distribution ÷ respective pre-distribution NAV.
Is 12% normal?
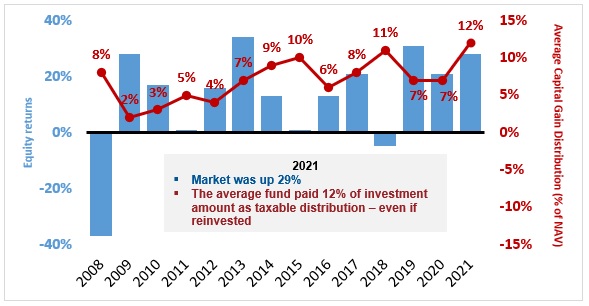
No! The significance of this year’s average distribution becomes clear when you pan out and look at distributions from a historical perspective, illustrated below. Dating back to 2008, you will see strong and consistent U.S. equity returns (in blue) accompanied by a varying magnitude of distributions (in red). Standing on the highest pedestal is 2021, with a 12% average U.S. equity distribution. Looking under the hood, distributions were elevated across asset classes and not necessarily isolated to U.S. equities.
2021 capital gains distributions in context
Source: Russell Investments and Morningstar Direct, as of 12/31/2021. Equity Returns: Russell 3000® Index. U.S. equity funds: Morningstar broad category ‘US Equity’ which includes mutual funds and ETFs (and multiple share classes). For years 2001 through 2020 % = calendar year cap gain distribution ÷ year-end NAV, 2021 % = total cap gain distribution ÷ respective pre-distribution NAV. For years 2001 through 2013, used oldest share class. 2014 forward includes all share classes. Indexes are unmanaged and cannot be invested in directly. Returns represent past performance, are not a guarantee of future performance, and are not indicative of any specific investment.
Distributions had breadth
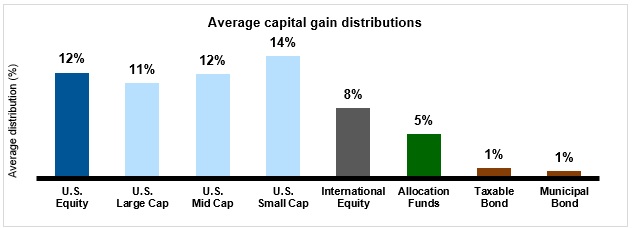
Breaking down U.S. equities by market cap (see below), the range of distributions were tight but substantial, averaging between 11%-14%. This implies all U.S. equity asset classes were impacted similarly on average. Other categories, such as international equity and asset allocation funds¹, came in a bit lower, but they still posted an average distribution in the mid- to upper- single digits. Moving away from equity, municipal bonds—an asset class known for its tax efficiency—generated an average distribution just under 1%. As you can see, there were not many places to hide in 2021.
To offer even greater understanding about the distributions made in 2021, we examined funds that are considered tax-managed, and there was not much shelter here either. Below are a few examples of what we have seen.
- U.S. large cap equity: Three funds had distributions ranging from 4% to 13%. One fund is posting its second straight year in the double digits.
- U.S. small cap equity: Two funds with distributions in the 7%-8% range.
- International equity: Three funds with distributions in the 4%-10% range.
As the above indicates, there were a handful of proclaimed tax-managed funds that couldn’t shield investors from the tax bite.
Click image to enlarge
Source: Russell Investments and Morningstar Direct, as of 12/31/2021. Categories based on Morningstar Category Group which includes mutual funds and ETFs (and multiple share classes). The average capital gain distribution % is calculated using the total capital gain distribution and respective pre distribution NAV as reported by Morningstar. % of NAV is calculated as (total capital gain distributions ÷ respective pre-distribution NAV).
Why be average when you can be below average?
When it comes to average capital gain distributions, my colleague Frank Pape said it best in his recent blog post. “Bear in mind, these are averages. We know some distributions are higher, some are close to the average and some are lower.” But the main take away for 2021 is, the average was HIGH! At Russell Investments, when it comes to capital gains distributions, our goal is not just to come in below average, but closer to zero.
So, faced with record capital gains distributions this year, how can you prepare for potentially difficult conversations with your clients? Take a look at our Form 1099 tax guide for insight and ideas for actions you can take to improve the tax efficiency of your clients’ portfolios. It may make sense to transition all (or part) of a portfolio to a more tax-managed approach. Reach out to your Russell Investments representative to find out more about how tax-managed investing can help reduce the impact of taxes on investments.
More importantly, how can you start the conversation about taxes with your clients to possibly avoid such large tax bills in the future? Stay tuned next week for a blog that could give you simple analogies or stories you can use with your clients to help them understand the impact taxes can have on their portfolios. And download our client-ready 1099 guide that can be used as a tool to diagnose the tax efficiency of your clients’ investments.
¹ Asset Allocation Fund: Funds in balanced categories that offer investors a mix of stocks and bonds to provide capital appreciation, income, diversification, or specific allocations based on planned retirement dates. This group also includes funds that invest in convertibles, which act a bit like stocks and a bit like bonds.