DB plan discount rates are setting new historical lows

Subscribe

Connect & follow us

Disclosures

These views are subject to change at any time based upon market or other conditions and are current as of the date at the top of the page. The information, analysis, and opinions expressed herein are for general information only and are not intended to provide specific advice or recommendations for any individual or entity.

This material is not an offer, solicitation or recommendation to purchase any security.

Forecasting represents predictions of market prices and/or volume patterns utilizing varying analytical data. It is not representative of a projection of the stock market, or of any specific investment.

Nothing contained in this material is intended to constitute legal, tax, securities or investment advice, nor an opinion regarding the appropriateness of any investment. The general information contained in this publication should not be acted upon without obtaining specific legal, tax and investment advice from a licensed professional.

Please remember that all investments carry some level of risk, including the potential loss of principal invested. They do not typically grow at an even rate of return and may experience negative growth. As with any type of portfolio structuring, attempting to reduce risk and increase return could, at certain times, unintentionally reduce returns.

Frank Russell Company is the owner of the Russell trademarks contained in this material and all trademark rights related to the Russell trademarks, which the members of the Russell Investments group of companies are permitted to use under license from Frank Russell Company. The members of the Russell Investments group of companies are not affiliated in any manner with Frank Russell Company or any entity operating under the "FTSE RUSSELL" brand.

The Russell logo is a trademark and service mark of Russell Investments.

This material is proprietary and may not be reproduced, transferred, or distributed in any form without prior written permission from Russell Investments. It is delivered on an "as is" basis without warranty.

¹ Introduced with MAP-21 in 2012 (The Moving Ahead for Progress in the 21st Century Act), then continuing with HATFA (Highway and Transportation Funding Act) in 2014 and BBA (Bipartisan Budget Act) in 2015.

² This chart assumes a set of liability cash flows with a duration of about 12 years.

³ FTAP (funding target attainment percentage) and AFTAP (adjusted funding target attainment percentage) are used to determine a variety of DB-related implications, including benefit restrictions, quarterly contributions and contribution requirements.

First used: February 2020

AI-28064-02-23

Due to declining treasury rates and tighter spreads, defined benefit (DB) plan sponsors are facing the lowest discount rates in the modern era. This has led to increased liability valuations, and thus lower funded status for many plans. This hurts the balance sheet and a variety of other measures that can influence the extent and timing of contributions, the level of Pension Benefit Guaranty Corporation (PBGC) premiums and whether risk transfer can be pursued. But to what extent will the recent fall in discount rates really impact sponsors? That depends on which measure you are focused on.

Sponsors are primarily concerned with corporate bond discount rates, as they are used in both funding and accounting calculations. However, since the introduction of pension funding stabilization¹ in 2012 , smoothing of discount rates over extended periods of time has become the norm for certain key funding measures. While providing sponsors with funding flexibility (albeit with corresponding PBGC penalties), funding stabilization has distinctly bifurcated corporate DB discount rates into two categories:

  1. Smoothed/funding discount rates

    • These rates are used to determine contribution requirements and benefit restrictions.
    • At present, they are based on a 90% corridor below the 25-year average of IRS discount rates.
    • Currently, these rates are about 5.5% and decreasing each year in a predictable manner, as the 25-year average declines and future corridor expands.
  2. Marked-to-market/accounting discount rates
  • These rates are used for balance sheet, pension expense and PBGC premium purposes.
  • As there is no smoothing of these rate, they are subject to significant volatility over time.
  • They are currently lower than 3% for many DB plans.

The following chart illustrates the pattern of these two discount rates over the last eight years, since funding stabilization was enacted.²

Funding and Accounting Discount Rates

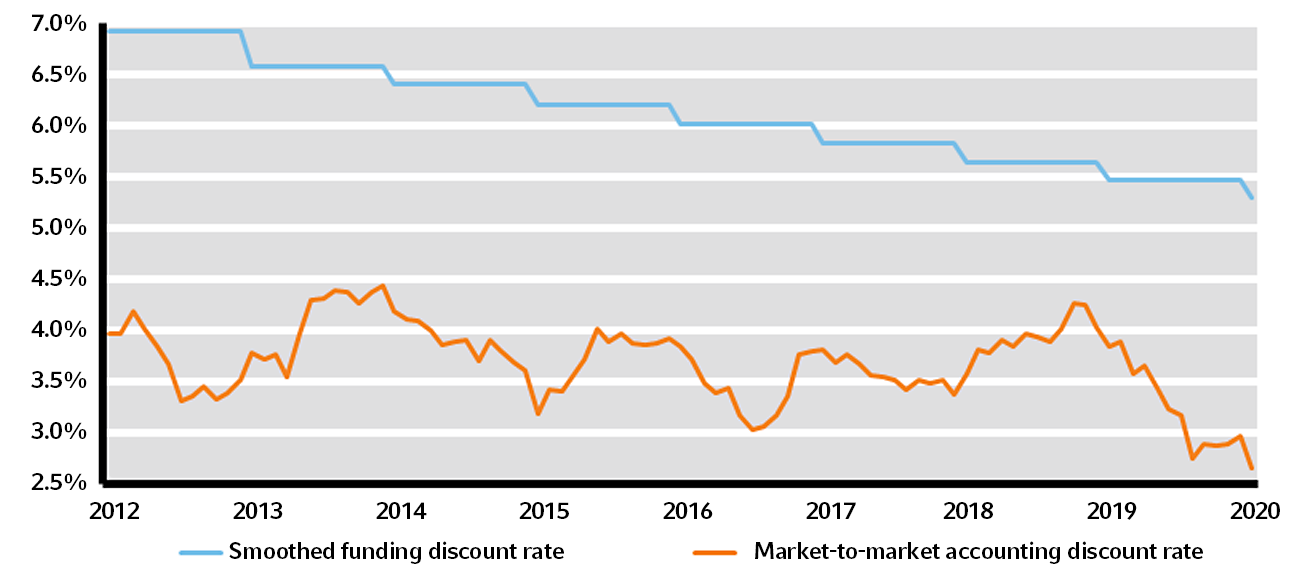
Source: IRS, FTSE Pension Discount Curve

This chart makes clear the stark difference in predictability of the smoothed versus marked-to-market rates since 2012, but it also illustrates the large and persistent gap between the two measures. The average difference over this time horizon is about 240 bps and has ranged from 140 bps to 360 bps. While the smoothed rates have declined in a predictable fashion, marked-to-market rates have also declined—particularly over the last year.

Despite these lower rates, many sponsors may still claim to be fully funded, referring to their FTAP or AFTAP³ status, calculated by their actuary with smoothed discount rates. They often have no-or-negligible contribution requirements, and any PBGC premium may not receive attention, as it can be paid out of plan assets. But what would the equivalent funded status be using current marked-to-market rates? The difference can be significant.

DB investment outsourcing

A dynamic approach to managing your pension plan, linking your investment strategy to your organization's goals.

gyroscope spinning black background

Assuming for the moment that funding and accounting calculations use the same liability assumptions—except for the discount rate—let’s see how much lower a plan's funded status can be, moving from one measure to another, for various liability durations.


Estimated underlying marked-to-market funded status
Funded status using smoothed rates  8-year liability duration 12-year liability duration  16-year liability duration
110% 91% 84% 78%
 100%  83%  76%  71%
 90%  75%  69%  64%

Source: Russell Investments, based on marked-to-market rates as of January 31, 2020

As you can see, the duration of the liabilities has a significant impact on the difference between the two measures. Note that if the accounting liabilities were to include future pay increases, the impact would be even more significant. It can be disheartening for a plan sponsor who is perceived to be 100% funded on one measure to really be as low as 70%. This has implications for PBGC premiums, additional filings and the effects of benefit payment drag.

Barring future changes to pension law, sponsors ought to be mindful of the coming phase-out of funding relief. With the ongoing decline in the 25-year average determined by the IRS, and the 90%/110% corridor expanding from 2021, the effects of funding relief will increasingly wear away. Contribution requirements will increase for many plans, bringing marked-to-market liabilities into economic reality.

As always, we stand prepared to help clients assess the associated implications for investment strategy and contribution policy into the future.

Disclosures

These views are subject to change at any time based upon market or other conditions and are current as of the date at the top of the page. The information, analysis, and opinions expressed herein are for general information only and are not intended to provide specific advice or recommendations for any individual or entity.

This material is not an offer, solicitation or recommendation to purchase any security.

Forecasting represents predictions of market prices and/or volume patterns utilizing varying analytical data. It is not representative of a projection of the stock market, or of any specific investment.

Nothing contained in this material is intended to constitute legal, tax, securities or investment advice, nor an opinion regarding the appropriateness of any investment. The general information contained in this publication should not be acted upon without obtaining specific legal, tax and investment advice from a licensed professional.

Please remember that all investments carry some level of risk, including the potential loss of principal invested. They do not typically grow at an even rate of return and may experience negative growth. As with any type of portfolio structuring, attempting to reduce risk and increase return could, at certain times, unintentionally reduce returns.

Frank Russell Company is the owner of the Russell trademarks contained in this material and all trademark rights related to the Russell trademarks, which the members of the Russell Investments group of companies are permitted to use under license from Frank Russell Company. The members of the Russell Investments group of companies are not affiliated in any manner with Frank Russell Company or any entity operating under the "FTSE RUSSELL" brand.

The Russell logo is a trademark and service mark of Russell Investments.

This material is proprietary and may not be reproduced, transferred, or distributed in any form without prior written permission from Russell Investments. It is delivered on an "as is" basis without warranty.

¹ Introduced with MAP-21 in 2012 (The Moving Ahead for Progress in the 21st Century Act), then continuing with HATFA (Highway and Transportation Funding Act) in 2014 and BBA (Bipartisan Budget Act) in 2015.

² This chart assumes a set of liability cash flows with a duration of about 12 years.

³ FTAP (funding target attainment percentage) and AFTAP (adjusted funding target attainment percentage) are used to determine a variety of DB-related implications, including benefit restrictions, quarterly contributions and contribution requirements.

First used: February 2020

AI-28064-02-23