Municipal bond outlook 2023: Three reasons for optimism
Executive summary:
- We believe municipal bonds boast several key factors that position them as an attractive asset class in general, but especially so when markets are volatile
- Structural resilience has helped the municipal bond market offer attractive stability and credit strength
- Attractive after-tax income potential and current yields offer potential advantages during a time when future rate changes are uncertain.
Municipal bonds had a tough 2022. But 2023 is looking much better and that makes us optimistic about the potential benefits of considering this asset class for client portfolios.
Inflation has begun to moderate, and yields declined sharply in January, which supported the municipal bond market to start the year. The Bloomberg Municipal Bond Index rose +2.9% in January while municipal bond funds saw their first positive inflow month since June 2022 and second since January 2021*.
This is a welcome rebound from 2022, in which the index ended -8.5% lower than the start of the year, recording only the 7th negative year since 1980 and the 2nd worst on record. Additionally, municipal bond mutual funds experienced their largest-ever annual outflow of -$119 billion, more than doubling the previous record set in 2013 (-$58 billion)*. While mainly driven by inflationary concerns and the fear of rising rates, tax-loss harvesting may also have played a significant role as investors scrambled to create tax assets within their portfolios.
Understanding that volatility is likely to continue, we believe municipal bonds have a more attractive outlook than their taxable bond counterparts and could be worthy of consideration for your clients.
There are three reasons for our optimism:
- Embedded resiliency
- Fundamental credit strength
- Income-generating potential
While these have always served as strong reasons to consider investing in municipal bonds, they’re even more important now after the walloping the asset class took in 2022.
1) Embedded resiliency
Municipal bonds boast three key factors that position them as an attractive asset class in general, but especially so when markets are volatile.
Budget control
Rainy Day Funds (RDFs)
Click image to enlarge
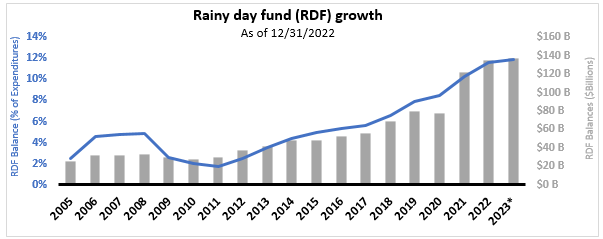 Source: NASBO. Rainy Day Fund Growth: National Association of State Budget Officers. Note: Figures for fiscal 2022 exclude Georgia, Texas, and Wisconsin. *Figures for 2023 are projected based on enacted budgets.
Essential Services
2) Fundamental credit strength
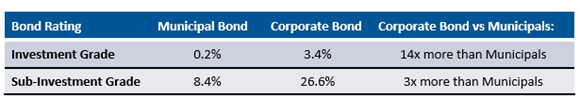
The second reason is an offshoot of the characteristics mentioned above which have helped to drive stronger credit relative to taxable counterparts. Credit strength is a risk factor that investors should consider when deciding on which parts of the fixed income market to invest in—particularly if they are concerned about an economic downturn which could cause an increase in defaults.
In terms of credit strength, the chart below illustrates historic default rates which demonstrates municipals’ superior quality over taxable bonds. Unlike corporate bonds, municipal bonds have several advantages (mentioned above) to help manage any financial distress. Each of these advantages have helped contribute to historically low relative default rates.
As an example, in the last 15 years ending January 1, 2022, BBB-rated municipal bonds—the lowest rung of investment grade—have experienced only a 1% default rate. That is the same rate as AAA-rated corporate bonds. Talk about attractive credit strength!
Click image to enlarge
Source: Standard and Poor’s. S&P’s default rate study represents a 15-year cumulative default rate form January 1, 1986 – December 31, 2021 (municipal bonds), and January 1, 1981-December 31, 2021 (corporate bonds).
If we were to make broader comparisons to demonstrate municipal bonds’ history of relatively strong credit quality:
Default rates:
Click image to enlarge
 Source: Standard and Poor’s. S&P’s default rate study represents a 15-year cumulative default rate form January 1, 1986 – Jan 1, 2022 (dated January 25,2022) (municipal bonds), and January 1, 1981-January 1, 2022 (dated November 5, 2022) (corporate bonds).
3) Income-generating potential
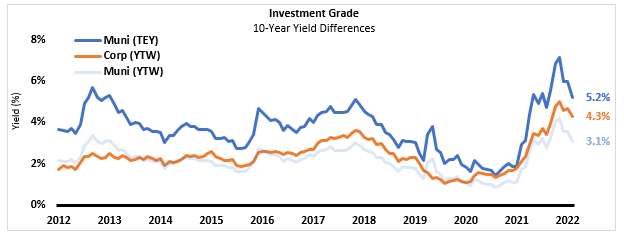
Relative to taxable bonds, the federally tax-exempt nature of municipal bonds leads to lower nominal yields at times, over the last 10 years this was 0.2% lower on average relative to corporate bonds. So it’s important to adjust yields for taxes when comparing income-generating potential of municipal bonds relative to their taxable counterparts.
When taxes are considered, the yield differential becomes more attractive as municipals generated a yield that was 1.3% higher on average over that same time period. This is demonstrated in the graphs below (assuming a 40.8% personal income tax rate1 ). Given the current yield environment as of 1/31/2023, the gap in yields has become even more pronounced. For instance, a taxable fixed income investor in the top tax bracket would need to earn a taxable yield of:
In order for an investor to get the same after-tax yield as an investment grade municipal bond, they would have to invest in high yield corporate bonds. Yet, this would incur much higher default risk.
Click image to enlarge
Click image to enlarge
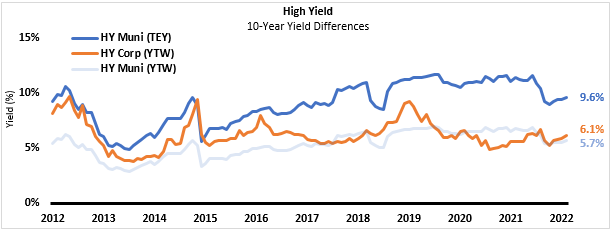 Source: Barclays. Bloomberg indices: Corporate Bond = U.S. Aggregate Bond Index; HY Corporate Bond = U.S. High Yield Corporate Bond Index, Municipal Bond = Municipal Bond Index, HY Municipal Bond = High Yield Municipal Bond Index. Yield quoted represents the Taxable Equivalent Yield (TEY) for Municipal and HY Municipal Bonds and Yield-to-Worst (YTW) for Corporate and HY Corporate bonds from 1/1/2013-1/31/2023. Marginal Tax Rate used is 40.8% (37.0% + 3.8%). Index returns represent past performance, are not a guarantee of future performance, and are not indicative of any specific investment. Indexes are unmanaged and cannot be invested in directly.
The bottom line
When you couple the three supporting factors with the potential investment benefits offered by municipal bonds, you come away with the following potential advantages: Structural resilience which has helped the municipal bond market offer attractive stability and credit strength. Attractive after-tax income potential, and current yields are in a position to offer potential advantages during a time when future rate changes are uncertain.
Don’t let market uncertainty disrupt your investment plan. Investors should consider all their available investment options and the relative value they add to a well-diversified portfolio.
*Source: Morningstar Direct
1Assumes the highest income tax rate of 37% plus the 3.8% NII tax.