Is today’s bull market sustainable?
U.S. and global equity markets are up 92% and 81% (in U.S. dollar terms), respectively, from their March 23, 2020, lows through May 31, 2021.1 The transition from pandemic uncertainty toward reopening optimism was swift. Global policymakers’ historic stimulus, coupled with the unprecedented speed at which viable vaccines came to market, boosted the outlook and supported market optimism—and, in turn, equity prices. The flip side, however, is that share prices are no longer universally appealing. This has sparked a key question among investors: Is this bull market sustainable?
From bear to bull in 128 days: The stock market’s astonishing recovery
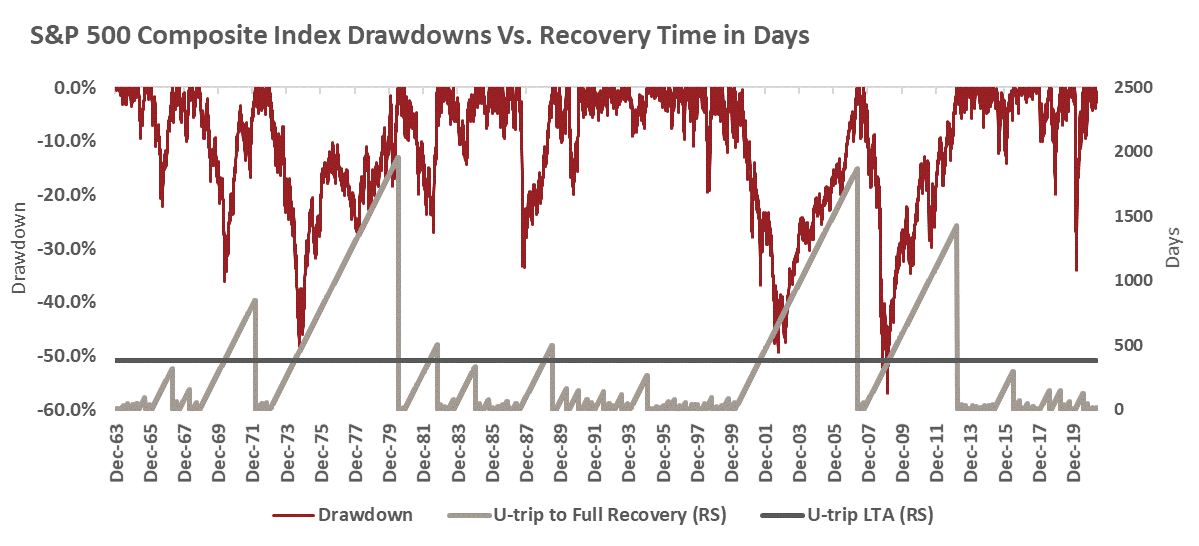
Before we address that question, it is worth providing historical context to the current equity rebound. Historically, the number of days it takes for the S&P 500 Index to recover to the level at which the drawdown commenced, which we colloquially refer to here as a U-trip, is about 380 days, as illustrated in the chart below. That's the average, while specific bear markets have taken much longer. For instance, the U-trip took about 1,400 days during the 2008-09 Global Financial Crisis (GFC) bear market, while it took an even longer 1,800 days during the dotcom bust of the early 2000s. While the pandemic drawdown last year was not as severe as those examples, it was meaningful nonetheless, with the S&P 500 sinking 34% from peak to trough. What's remarkable, however, was the speed of the recovery. Last year's pandemic crisis U-trip took just 128 days—significantly less than the long-term average, despite a once-in-a-generation healthcare crisis.
Click image to enlarge
The equity market is the ultimate leading indicator, and fundamentals have underpinned the rally. Market enthusiasm reflected the torrid pace with which the global economy and corporate earnings have been recovering—both at above-trend levels.
The global economic rebound: An uneven recovery
Let's start with the global economy. As the chart shows, gross domestic product (GDP) growth bottomed for most regions in the second quarter of 2020; however, the downturn's severity varied across regions. Areas where the virus was most challenging and(or) required restrictive lockdowns experienced the sharpest contractions, such as the UK and the eurozone. However, for many Asian nations, the pandemic pressures were less intense and, as such, many endured a shallower recession, including several emerging markets (EM) countries, as well as Japan. Importantly, as the global recovery commenced, the virus was often the critical determinant of the recovery speed—with the additional waves of the virus that spread across Europe stalling the region’s recovery.
Meanwhile, the lockdowns in the U.S. were never as strict as in Europe. Coupled with massive fiscal stimulus boosting demand, this buoyed the U.S. into a top performer globally. Canada also benefited from its own fiscal stimulus, the strength of the U.S. recovery, as well as a booming housing market. Finally, the Australian economy, remarkably, is above its pre-pandemic level. Like EM, Australia was able to limit the virus outbreak within its border by shutting the continent to international travel. The nation also benefited from its close trade linkages with China – which was the first nation to enter the crisis and exit. The bottom line is that while the recovery speed has varied, the global economy is clearly on the mend.
Click image to enlarge
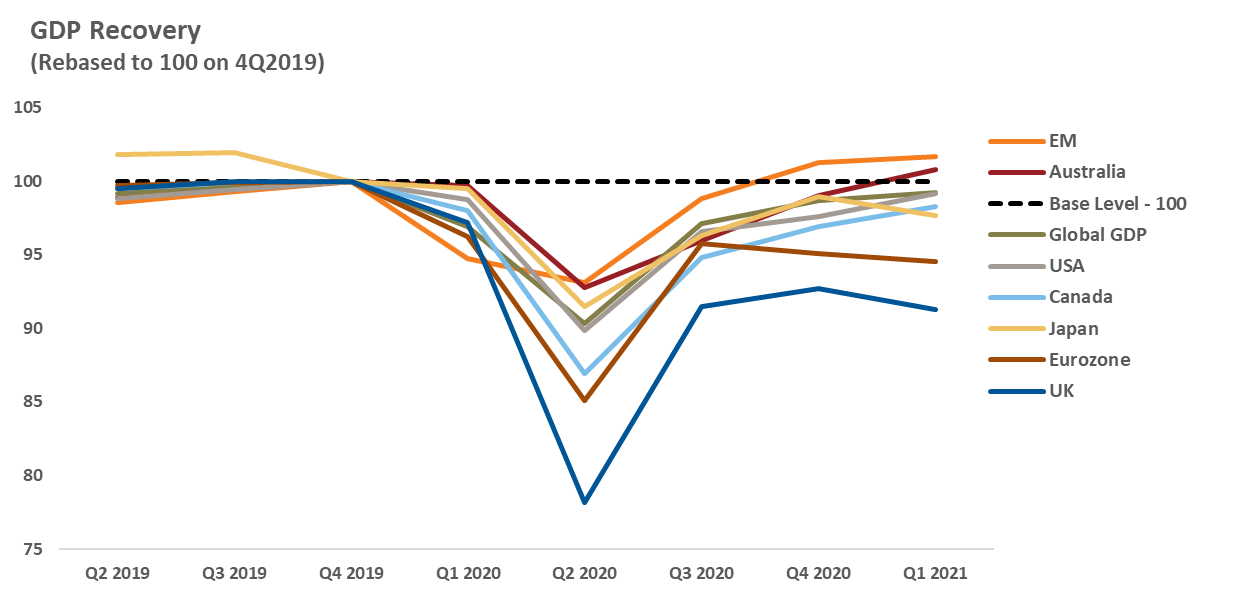
Source: Refinitiv DataStream, Russell Investments. EM and Global GDP data based on Oxford Economics estimated growth as of 3Q 2020.
GDP=gross domestic product, the total value of the goods and services produced in a country.
Growth outlook for the rest of 2021: Could Europe outpace the U.S.?
While the chart above provides a perspective on the recovery so far, the chart below presents a perspective on the outlook (with some historical context). According to the International Monetary Fund (IMF), the global economy in 2020 experienced its first annual economic contraction since the GFC—and a much deeper one at that. For example, the chart below shows that the world economy barely contracted in 2009, versus a 3.3% contraction in 2020. Similarly, both the U.S. and eurozone area experienced a deeper recession in 2020, with high-growth EM contracting by 2.2%, compared with a 2.8% expansion during the GFC.
All that said, the pandemic downturn will likely be one of the shortest recessions in history, as the global economy transitioned quickly from recession to recovery, as previously discussed. Moreover, due to the boost in demand from historic fiscal and monetary policies, the projected GDP growth in 2021 and 2022 for all regions is above respective long-term averages.
Importantly, we believe that the next phase of the reopening/recovery favors regions outside the U.S. Why? Take Europe, for example. For most of this year, Europe’s consumer spending has been limited due to restrictive lockdowns. These restrictions are now easing as more individuals are vaccinated. This potentially sets up an unleashing of pent-up demand, which we believe will improve the growth outlook for the broader European economy over the second half of 2021 and beyond. Further to that point, the IMF expects that GDP growth in Europe will exceed that of the U.S. in 2022.
Click image to enlarge
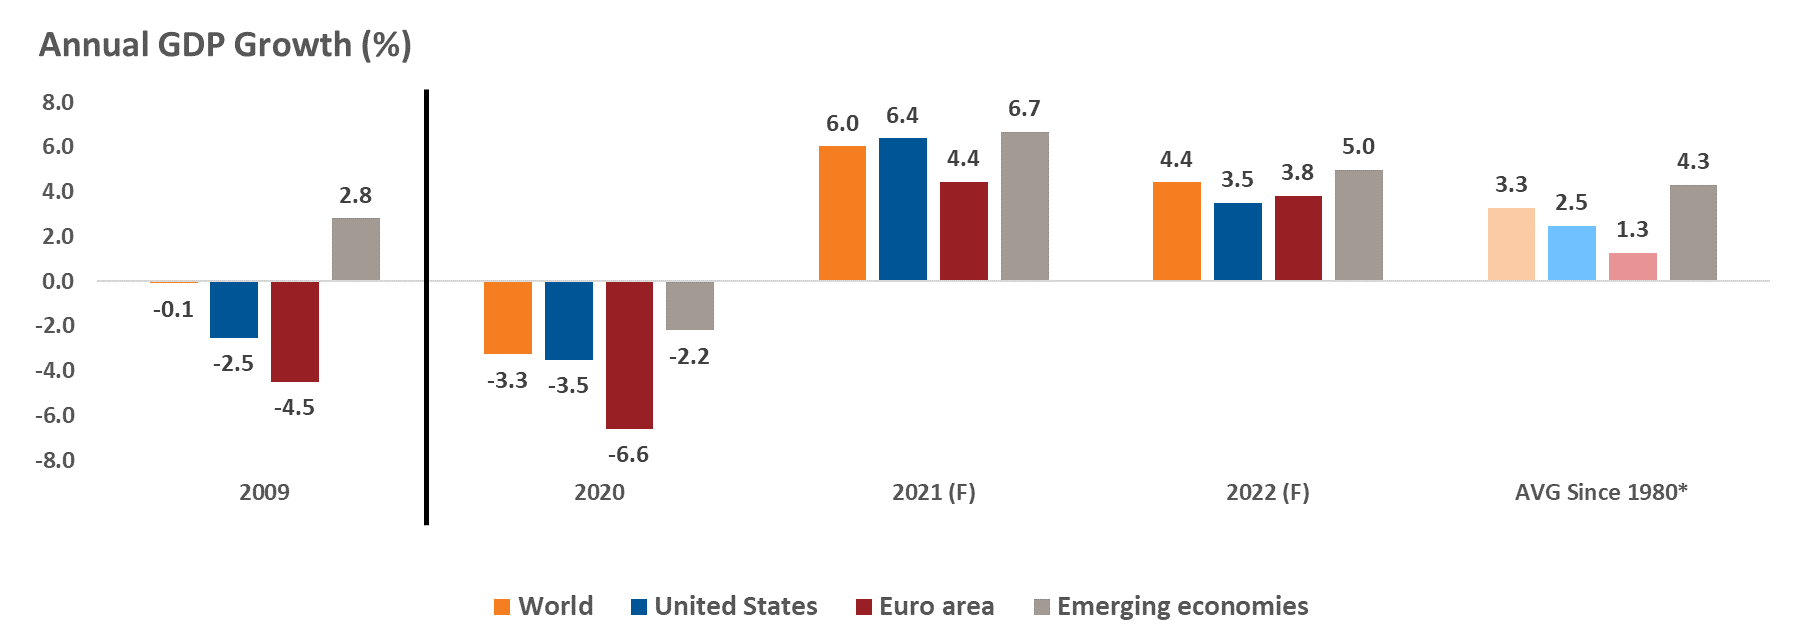
Source: International Monetary Fund (IMF) April 2021 World Economic Outlook, Russell Investments.
"(F)" above represents forecasts and "AVG" means average.
Earnings outlook: Robust growth to continue?
Switching to earnings, corporate profitability has experienced an even more impressive revival than the global economy. The two charts below highlight rolling year-over-year gains for the U.S. (top) and international (bottom) equity markets, compared to the yearly growth of trailing 12-month earnings for the respective index. The graph visualizes the leading properties of the equity markets, with annual advances in equity prices slightly foreshadowing earnings growth. For instance, equity prices bottomed in March 2020, while trailing 12-month earnings did so in December of that year.
Click image to enlarge
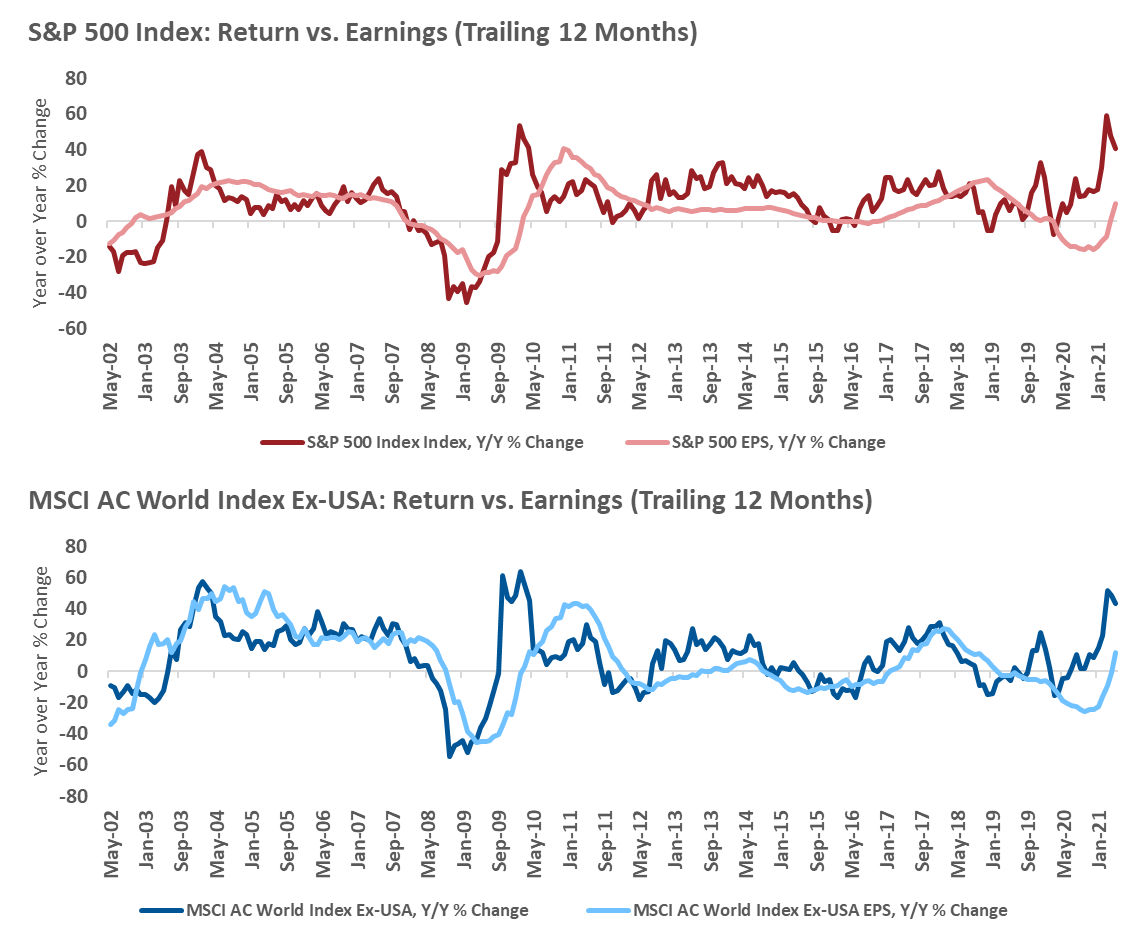
Source: Refinitiv DataStream, Russell Investments. As of June 1, 2021.
Indexes are unmanaged and cannot be invested in directly. Past performance is not indicative of future performance.
Considering the strength of the markets, earnings increases must validate equity price gains. To that end, based on earnings-per-share (EPS) growth estimates for 2021 and 2022, shown below, the outlook looks encouraging. Moreover, even though EPS growth in 2022 will naturally decelerate from post-reopening-boom 2021 levels, both U.S. and ex-U.S. earnings growth are expected to stay above their respective long-term averages. In fact, the resurgence of U.S. earnings was SO strong that S&P 500 companies regained their peak profitability by the fourth quarter of 2020 (on an unsmoothed basis).
Click image to enlarge

Source: Refinitiv DataStream, Russell Investments. Estimates as of May 28, 2021.
Market outlook: Could equity prices climb higher?
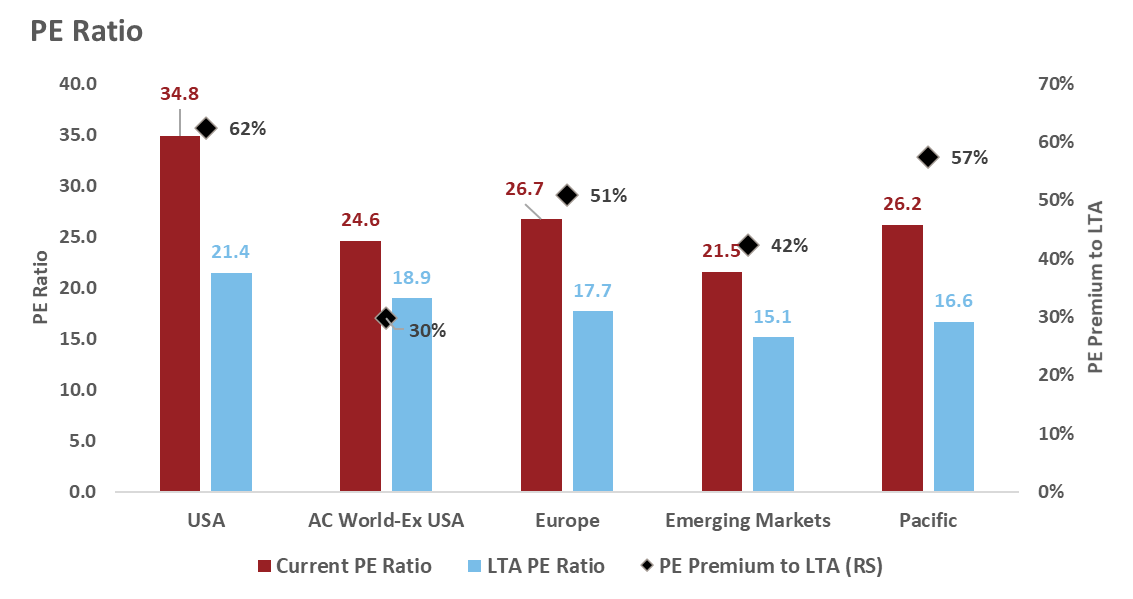
The outlook for both the economy and earnings over the next couple of years is naturally positive for financial markets. However, the challenge is that despite a robust outlook for earnings, current valuations, shown below, already reflect some of this optimism. Most regions are trading at a price-to-earnings (PE) ratio richer than their respective long-term average (LTA). However, the chart also makes the case that the current valuation is more interesting outside the U.S. for all regions shown. Moreover, international markets look less stretched relative to their own historical-average PE ratio. In other words, they trade at a lower PE premium versus the U.S.
For example, the U.S. PE ratio trades at a 62% premium to its long-term average (34.8 vs. 21.4) versus 30% (24.6 vs. 18.9) for the world ex-USA. The crucial takeaway here is that while valuations are no longer cheap, modest increases in equity prices are possible as earnings grow into current valuations. Moreover, regionally, non-U.S. markets appear better priced than the U.S.—with their appeal boosted by sector composition. Non-U.S. markets are more cyclical and will likely be more significant beneficiaries of a broader global reopening.
Click image to enlarge
Source: Refinitiv DataStream, Russell Investments. Based on 20 years data as of May 2021, except for Pacific measured from June 2010. Equity region based on respective MSCI Index. AC= All Country, PE = Price to Earnings, LTA = Long Term Average.
The bottom line: Positive outlook for stocks
So, to answer our original question, is the current bull market sustainable? Considering our positive business cycle outlook for the global economy, very low odds of a recession over the next couple of years, accommodative monetary policy and encouraging earnings prospects, we believe the balance of risk for equities is to the upside. Still, the outlook is not without risks, and several are worth highlighting:
- Pandemic – We believe the worst is in the past, but vaccinating the world will take time, which means certain parts of the globe will remain vulnerable come next flu season. Virus mutations are another wildcard.
- Taxes – U.S. President Joe Biden's ambitious spending objectives indicate taxes are likely to head higher for corporations and individuals. This introduces some vulnerability to equity markets.
- Debt – U.S. household balance sheets are a bright spot; however, high corporate and government debt poses some risks to future growth. However, with interest rates expected to remain low over the forecast horizon, this is not an immediate risk.
The key takeaway is that economic output and corporate earnings are projected to grow above-trend over the next couple of years. Valuations, however, are a concern, as much of this outlook is now reflected in current valuations. Nevertheless, a favorable business cycle means a recessionary bear market is very likely not around the corner—which keeps us constructive. However, some moderation in price advances is a reasonable expectation, if only to allow earnings to play catch-up to equity prices. Overall, we remain positive on equities, especially for regions outside the U.S. due to their greater cyclicality and relative value.
1 US equity = S&P 500 Index; global equity = MSCI World ex-USA Index.