$20 billion club: Assets and liabilities peak again while contributions plunge in another record-breaking year
Just two years ago, we wrote about a record-breaking year in which contributions, liabilities and assets all reached new heights. For quite some time, we have anticipated the moment when DB liabilities peaked for the 20 companies that make up the $20 billion club, who collectively sponsor about 40% of the DB liabilities of US-listed corporations. This seemed inevitable as the growth of many of the plans slowed via plan closures/freezes and significant risk transfer activity. However, due to persistently low discount rates, liabilities have continued to rise, reaching new levels at the end of 2019. Assets also experienced a significant increase in 2019 – rising 9.6% on average over the year.
However, unlike two years ago, contributions set a new type of record. Instead of rising, they fell to the lowest level since 2008 in the midst of the Global Financial Crisis. Clearly, sponsors are continuing to take advantage of ongoing pension funding relief.
Overall, the net effect of this is that funded status stayed roughly the same, likely frustrating sponsors who saw assets rise without a corresponding increase in funded position.
In 2019, assets and liabilities changed for this group in 2019. The year was noteworthy in at least five ways:
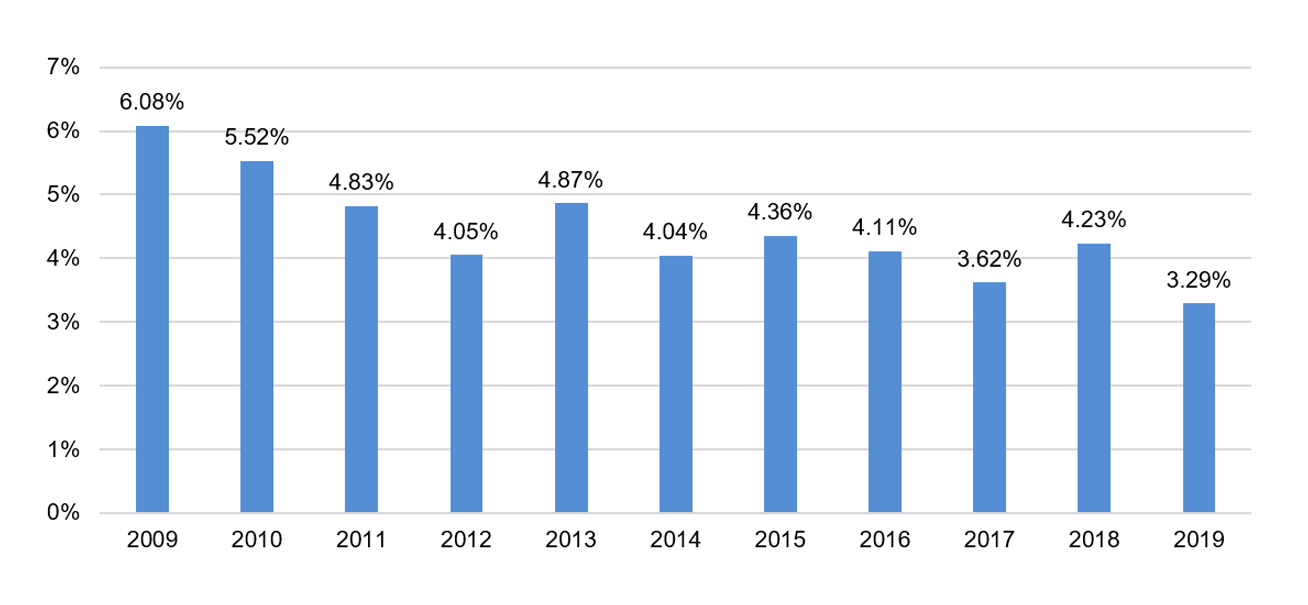
- Discount rates. As we recently blogged, discount rates plunged due to a combination of treasury rates declining and spreads tightening. While this is not unique in the roller coaster ride of discount rates in recent memory, the magnitude and absolute level of discount rates were significant. In recent history, we have not seen such a large drop (average of about 100 bps) nor a drop to such a low level (some discount rates are now below 3%).
Average discount rates
- Total liabilities. Many consider DB plans a relic from the past, but despite plan closures, freezes and large risk transfers, they are not going away quickly or quietly. In fact, the DB obligations held on these companies’ balance sheets is up from peak levels in 2017 of $975 billion to the highest on record of $981 billion due to the drop in discount rates. Will this be the peak level?
Total liabilities

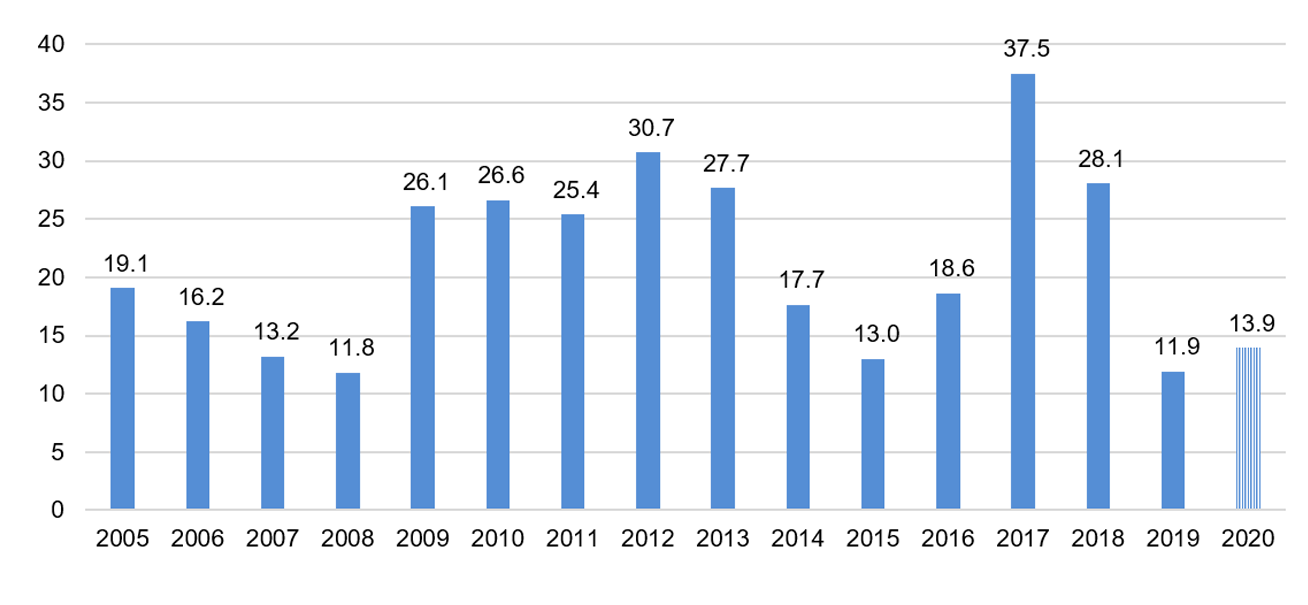
- Contributions. After a two-year boom motivated by tax reform, contributions in 2019 were drastically down to $12 billion from $28 billion the year before. With funding relief reducing or eliminating contribution requirements for plan sponsors, many find little motivation to contribute more than is required. The year 2020 continues this trend and would actually be less than 2019 if not for GE’s $4-5 billion contribution. The following chart illustrates this trend.
Total contributions
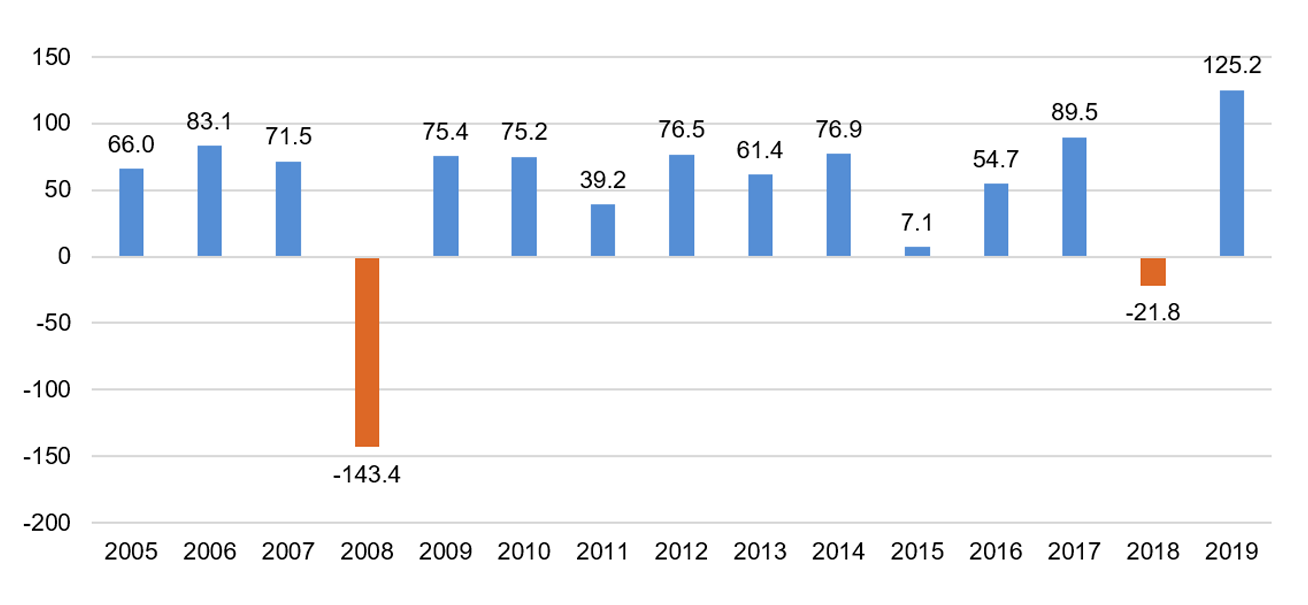
- Investment returns. Equity markets recovered well in 2019 from the downturn in late 2018, achieving the highest dollar return in investments for this group on record at $125 billion, far surpassing 2017 returns. This is particularly noteworthy for these DB plan sponsors as many of them have allocated significant portions of their portfolios to fixed income. Long-duration fixed income performed particularly well.
Investment earnings
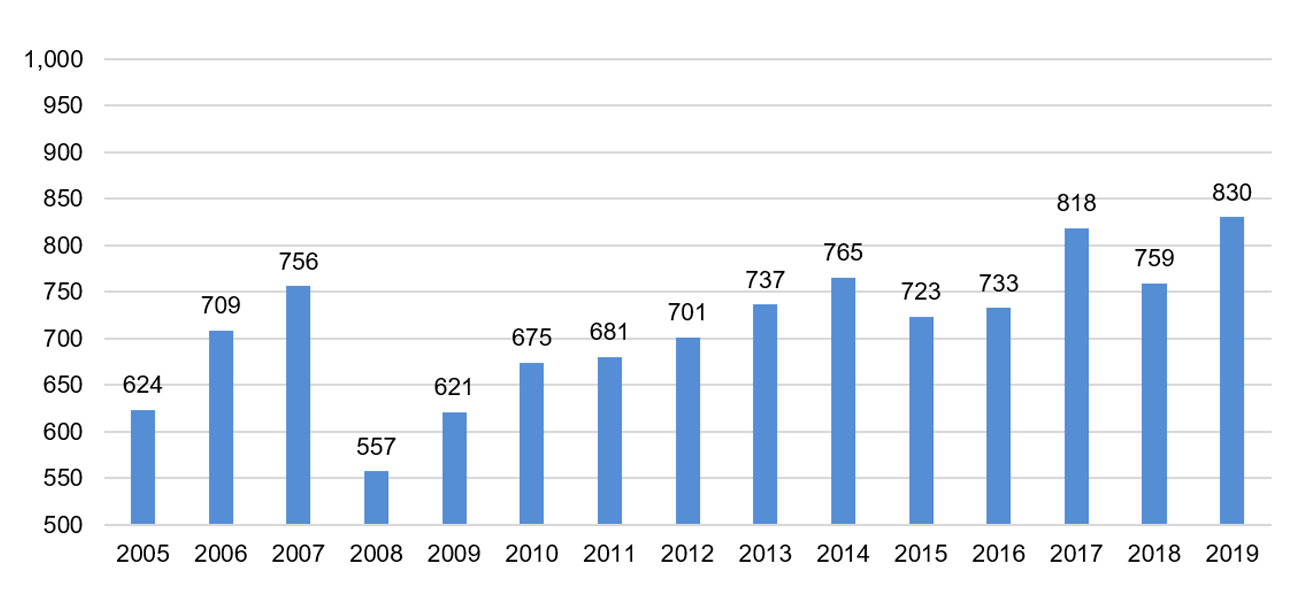
- Total assets. While contributions were down, investments earnings were sufficient to help the total asset base reach another all-time high to $830 billion. Due to the corresponding increase in liabilities, assets still have a long way to adequately fund these plans.
Total assets
Read this collection of "$20 billion club" blog posts
- Record-breaking contributions and returns for $20 billion club
- FedEx delivers the largest DB annuity purchase since 2012
- DB contributions expected to plummet in 2019
- DB plan discount rates are setting new historical lows
- Better late than never…GE pension risk in focus
- Tax Reform has been signed–what could this mean for DB plan sponsors?
- How long will DB funding relief last?