How could a flattening yield curve impact LDI portfolios?
We have seen an increasing amount of commentary on the shape of the U.S. Treasury yield curve, particularly around the spread between 2-year and 10-year yields. That research shows that an inverted yield curve has been a reliable predictor of recessions in recent economic cycles, which has obvious ramifications for future equity market returns. Here, we examine the other side of the coin for corporate defined benefit (DB) plans: how concerned should we be with a flattening yield curve when seeking to hedge liability volatility?
Not all liability volatility is created equal
When we think about the yield curve flattening, we generally envision a scenario where the U.S. Federal Reserve raises short-term rates, causing the short end of the curve to increase faster than the long end of the curve (this is commonly referred to as a “bear flattening” scenario). We less frequently consider the impact of the curve flattening due to a decline in long-term rates (“bull flattener”). Given our view that the currently reached 3% yield on 10-year Treasury notes may represent an approximate peak for yields in 2018, it is instructive to consider this latter scenario.
These two scenarios (bear and bull flatteners) impact defined benefit pension liabilities and hedging portfolios in very different ways. For starters, our research shows that though short-term interest rates are more volatile than long rates, long-dated liabilities account for much more of the interest rate volatility of a typical DB plan.
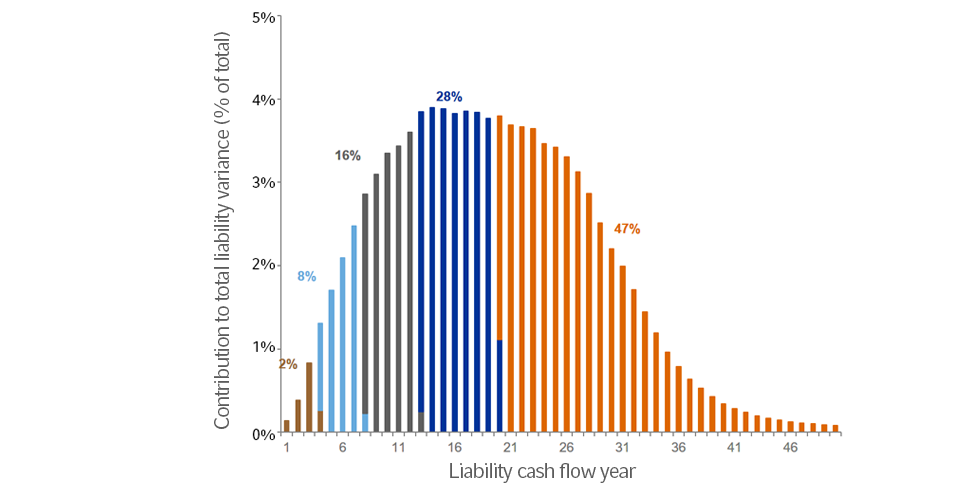
The chart below demonstrates this concept. Here we examine the relative risk of five different tranches of the liability of a representative DB plan. Here, each of the five colors represents cash flows that account for 20% of the total accounting liability of the plan. However, when we analyze the total contribution to risk of each of these groupings, we see that they are in no way equal. The shortest-dated 20% of the liability cash flows (representing years one through 3, in brown) accounts for only 2% of the total liability variance, whereas the longest-dated 20% of the present value (years 20 and longer) delivers nearly half (47%) of the volatility.
Impact of rate environment on funded status
Our forward-looking risk models show that for a typical DB plan, a bear flattening scenario where short rates rise faster than long rates will cause funded status to improve. This is because even small increases in long rates can have a relatively large effect on pension liabilities. Combine this with the reality that most corporate DB plans are less than 100% hedged to interest rate volatility and we end up with an environment where liabilities fall faster than hedging assets.
As demonstrated above, the bigger risk in a curve flattening environment is that long rates fall, driving up those more volatile long-dated liabilities. Here, an under-hedged position results in a decline in funded status as there are not enough hedging assets to keep up with liability growth. Given that long rates are less directly influenced by Fed policy, responding as well to such varied factors as inflation expectations, global economic growth, supply and demand issues, geopolitical factors, and myriad other concerns, it makes sense to intentionally build a liability hedging portfolio that directly targets the riskiest segments of the DB liability and focus less on the potential path of short-term rates.
Click to tweet : Is a bull flattener scenario riskier for DB plans?