What investors need to know about the surge in interest rate volatility
Executive summary:
- Interest-rate volatility on shorter-duration assets is running near historical highs, even as rate changes begin to level off.
- Interest-rate volatility typically coincides with strong fixed income returns. However, elevated volatility can be a signal that rougher times are ahead for the Treasury market and passive investments.
- We believe the current environment offers several exciting opportunities for active fixed income managers.
Since interest rates started rising in 2021, investors have closely followed changes in interest rates: Taking bets on what will be announced at an upcoming Fed meeting or expressing shock at the latest mortgage rate are common discussion topics today versus three years ago, but are interest rates more volatile? And as rate changes start to level off, is volatility leveling off too?
What's the difference and why should it matter to investors?
Interest rate volatility refers to the degree of fluctuation in interest rates over time, while changes in interest rates refer to the actual movements in interest rates. We leverage two standard measures of interest rate volatility: 1) the MOVE Index, a market-implied measure of Treasury bond volatility, and 2) standard deviations of Treasury futures contracts of different maturities. Decomposing the overall MOVE Index into components such as 2-year, 5-year, 10-year, or 30-year allows us to look at what part of the curve is the most volatile. What's interesting for investors is that interest rate volatility can be high even if the changes in interest rates are relatively small, and vice versa. Currently, we are experiencing a period where changes and volatility are decoupling: the rate of change is slowing but volatility continues to rise.
What does that mean for investors? At the most basic level, volatility matters to investors because it increases risk and the chance of loss, especially for investors who need to sell bonds before maturity. Interest rate volatility impacts different bonds differently, and investors can benefit from being aware of these differences. But it's not all bad news. As active investors, this type of environment also presents more opportunities. From our vantage point, this backdrop underscores the importance of partnering with a skilled OCIO provider who has extensive experience in risk management, including the ability to identify and exploit both risks and opportunities.
How does today's rate volatility stack up against past levels?
Let's start by examining how current interest rate volatility compares to historical levels before we turn to how it can impact portfolio performance.
In a nutshell: current volatility levels are historic. The MOVE Index, a frequently cited measure of interest rate volatility, is a yield-curve weighted index of volatility on Treasury options. Volatility has been on a steady rise since mid-2021, and while it has come off its March 2023 highs slightly, it remains historically elevated.
Figure 1: The MOVE Index
Click image to enlarge

Source: Bloomberg
Because it is a weighted average of different tenures, the MOVE Index does not allow us to see how volatility varies across the curve, so next we'll break down the Treasury market by maturity. Here we find that subcomponent volatilities are at all-time highs (2 and 5 year) or close to it (10 and 30 year), comparable only to 2008. Longer maturity bonds consistently will have higher volatility, so to make an apples-to-apples comparison we standardize1 volatility of each maturity to compare it to its own historical levels.
Figure 2: Treasury Futures Standardized Volatility, by Maturity
Click image to enlarge
 This higher frequency data reinforces what an exceptional period we are experiencing in 2023: as of the end of March, two-year volatility is at a near-historic high, having increased sharply in 2023. The current level is more than five times its inter-quartile range above the median, which has only happened once before—in 2008, during the height of the global financial crisis (GFC).
This volatility is largely centered on shorter-duration assets, which is also notable. Case-in-point: The 30-year Treasury note experienced much higher volatility during the COVID-19 crisis than today, and while the current 30-year volatility is at the higher end of its typical range, it's been relatively consistent over the last 12 months. 2-year volatility, on the other hand, has increased precipitously this year—even as rate changes have leveled off.
How does heightened rate volatility typically impact bond performance?
So, we are clearly experiencing a period of elevated interest rate volatility—especially on the shorter end of the curve—but what does this mean for investors? How does this impact bond performance? The short answer is that volatility has not historically been bad for bond performance—at least not immediately. However, it can portend difficult times ahead.
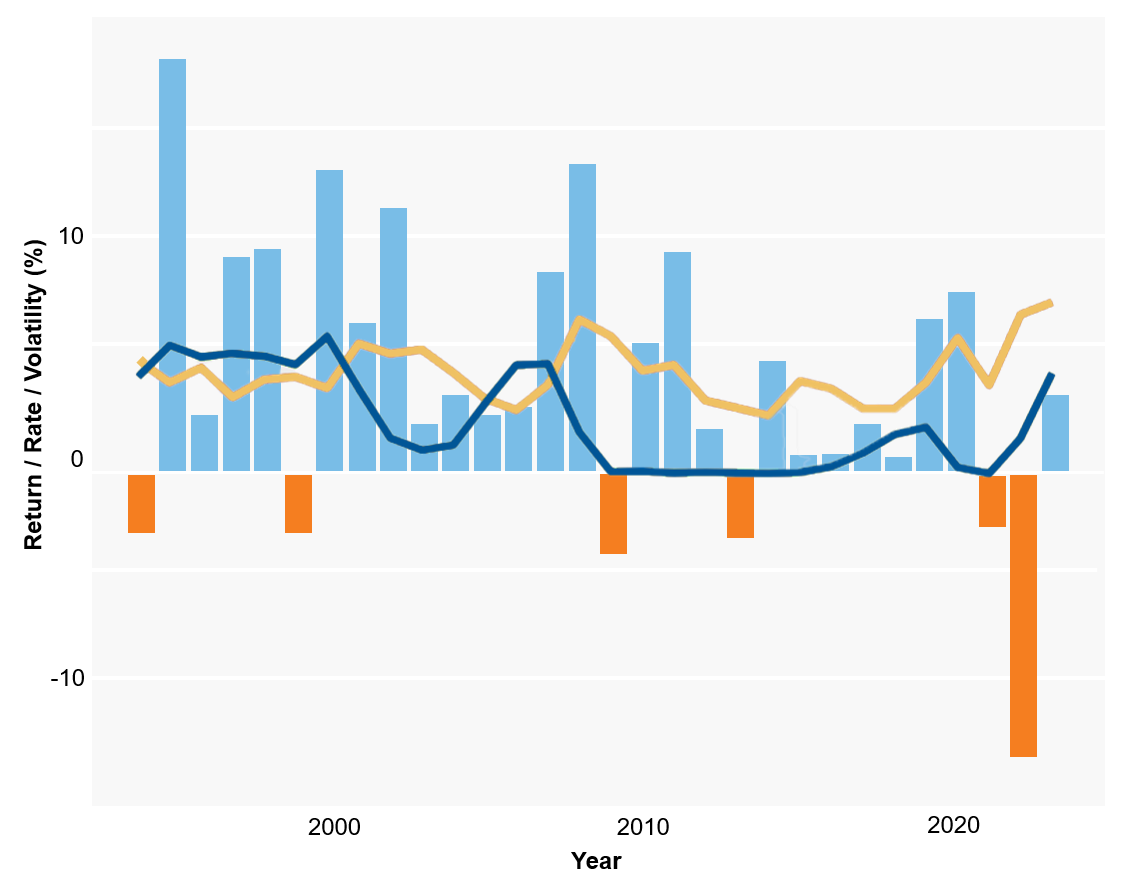
Going back to basics, below we consider annualized Treasury returns (blue/red bars) versus interest rate levels (green line) and interest rate volatility (green line). Here, we'll abstract from a discussion of different tenured bonds to look at the basic historical relationship. Broadly speaking, periods of high interest rate volatility (red line) are often good years for bond performance (bar). 2008 and 2020 are examples of this pattern: peaks in volatility coincided with exceptionally good years, compared to recent history. Importantly, however, both these periods were followed by negative performance. So, while volatility isn't necessarily a reason to run for the exits, it is a good time to pay attention to what you're invested in and question if you are ready for the rough ride ahead.
Figure 3: Bloomberg U.S. Treasury Index Annual Return (bar) and Volatility (yellow line) vs. Fed Funds Rate (dark blue line)
Click image to enlarge
Let's recap:
- Interest rate volatility levels are historic
- Volatility is most extreme for the short end of the curve (relative to historic levels). This contrasts with what we observed during the COVID-19 crisis and instead is more similar to the time period immediately before the GFC.
- Volatility typically coincides with strong fixed income returns, but it can portend periods of poor performance ahead, at least for the Treasury market and passive investments like we've investigated here.
What does this mean for investors?
All this volatility is associated with new risks. But for active investors, it also presents new opportunities. In a low-rate and low-volatility environment, a straightforward playbook has performed well: exposure to duration (long-dated assets) and credit (higher yield). Today, we are experiencing inverting and twisting yield curves, with historically large and fast moves. This means the bets that have worked for the last ten years are in jeopardy.
But it also presents a much wider range of ways to express active views. Taking a step back from interest rate volatility, this is a consistent theme right now for fixed income investors. The yield curve has been inverted for some time, a classic harbinger of difficult times ahead. This is also an environment where differentiating between which high yield issuer will survive versus who will default—i.e., being active and not passive—becomes critical.
We won't sugarcoat it: uncertainty about where we are going from here is high. The latest spikes in volatility caused by the recently resolved debt ceiling impasse mean there has been little let-up. However, what is clear to us is that this will be an exciting time for fixed income active management. Amid this backdrop, we're digging in with our active subadvisors and clients to get the most out of the opportunities this market presents.
1 Current observation minus its mean divided by its interquartile range.