Target date glide path expectations
401(k) participants and plan sponsors may be challenged to understand whether their future savings and investment plans combined with the range of likely market outcomes are consistent with their planned retirement income. We investigate a simple approach to compare the ambitiousness of a participant’s plan with the reality of growth available from existing target date solutions.
The industry provides a range of target date glide paths...and a range of different outcomes
With close to 40 providers of target-date funds in 2019, as detailed by Morningstar, the marketplace provides many options from which to choose. Each target date series is associated with a glide path that assigns an asset allocation between equity and fixed income assets for each year (or particular age of a participant). While all glide paths assign a higher allocation to equity assets when the investors are further from their retirement date, allocations across providers may differ by as much as 40% for participants at the same age.1
Exhibit 1 shows the available glide paths from Russell Investments (green line) and its largest competitors.2 The gray silhouette illustrates the range of the equity allocation before, at and during retirement. While we consider the extremes to mark the boundaries of available choices,3 it is worth noting that no single glide path maps to either the upper or lower limits of the gray range. We refer to the allocations along the upper boundary of the gray silhouette as the "Maximum" glide path an those falling along the lower boundary as the "Minimum" glide path.
Exhibit 1: Range of industry glide paths from largest competitors
Russell Investments and competitors' glide paths

A dollar saved early in one's career will initially have relatively high exposure to equity—this exposure declines to a lower allocation as retirement nears. The expected growth of each contributed dollar depends not only on which glide path it follows, but also on how many years of compounding it will experience prior to retirement. Using Russell Investments’ 20-year market forecasts as of June 2018, we estimate that a dollar contributed 40 years before retirement will grow at an annualized inflation-adjusted rate of 3.3% for the Minimum glide path, 4.1% for the Russell Investments’ glide path and 4.4% for the Maximum glide path.
These are average numbers over the entire 40-year period with growth in the early years expected to be higher than in later years due to the more aggressive allocation. A dollar contributed 20 years prior to retirement is expected to have lower annualized growth rates of 2.3% for the Minimum glide path, 3.8% for the Russell Investments’ glide path and 4.1% for the Maximum glide path. While the rates of growth are only a little lower for the dollar saved 20 years prior to retirement compared with the dollar that is saved for 40 years prior, the impact on retirement income from the earlier dollar is roughly two-and-a-half times as much as the dollar saved with only 20 years remaining, underlining the importance of early savings.
Overall, the expected rates of return provided by the glide paths fall in the range of about 1.5% (for savings that occur with only a small number of years remaining before retirement) to around 4.5% for a dollar contributed early in one' career. These are inflation-adjusted rates of return to support an easy comparison of purchasing power in today' dollars to purchasing power at retirement.
Custom glide paths, active management and higher return assumptions can influence the range of available returns. However, 1.5% to 4.5% provides a range for evaluating the reasonableness of a participants' plan for savings and the retirement income that it is likely to support.
How to evaluate the viability of the participants' plan
A simple way to evaluate the ambitiousness of a participants' plan is to calculate the rate of return required to grow the ongoing savings to an accumulated amount that will support the desired retirement income.4 If the required return falls outside of the range provided by glide paths, success may be unlikely.
Exhibit 2 provides the rate of return necessary for combinations of savings rates (as a percentage of contemporaneous salary) to cover the indicated retirement income level (expressed as a percentage of final salary) for a participant who starts saving at age 25 and plans to retire at age 65.5
The dark green and red lines bound the range of required returns that fall within the expected outcomes of equities (5.9%) and cash (1.4%) – the most aggressive and most conservative available portfolios, but are not representative of any industry glide paths. The orange shaded cells correspond to required rates of return that fall within the expected returns available from industry glide paths, and the gray shaded cells correspond to required rates of return that can be achieved with 75% confidence by a glide path in the range from Maximum to Minimum of the industry silhouette.
Exhibit 2: Required rate of return for a given savings rate and retirement income target
For an employee working from age 25 to age 65
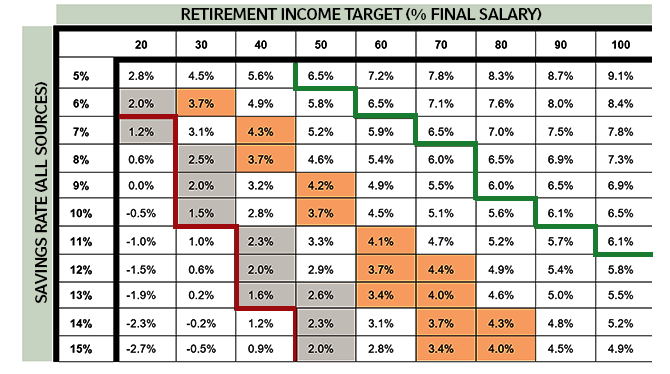
Combinations above the dark green line will only be accomplished with a healthy dose of luck, and they do not represent a reasonable plan while those falling below the red line signal the possibility of setting retirement income aspirations somewhat higher.
Of course, a similar required rate of return exercise could be pursued for participants who are older than 25 and/or who may already have accumulated a balance.
Repeat as necessary
The simple calculation of the return required for a participants' plan to be successful can easily be compared with the reality of returns available from industry glide paths to understand if the plan is well targeted without extensive and possibly costly analysis. Plans that are unlikely to have the desired outcome are quickly identified as are those that can aim higher.
The attractiveness of potential modifications (higher savings, lower retirement spending, deferred retirement, etc.) can be evaluated in the same manner with a consistent process allowing participants toa evaluate the impact of different choices that will lead them to a promising plan.