Don’t let the frame block the complete transition picture
As investors, we view risk as the potential to lose money. We measure this with VIX, standard deviation, value at risk, tracking error and other measures, but the universal goal of all investors is to minimize risk for a given exposure and return goal. We can now slice and dice risk in many different dimensions and focus our investment strategies on factors we believe will add the most value.
When we discuss risk, we talk in many different measurements, but we rarely contemplate timing. Investors rightly expect long-term performance to wash away any short-term variability, and a single day's performance should not impede a solid investment strategy—so we don't focus on myopic single-day performance. But what if that day, or portion of that day, represented 25% or more of your returns for the strategy? Without question, this would get an investor focused on the attribution of each day's outcome. And when volatility increases sharply, we become even more engrossed in the moment-to-moment swings in our portfolios. Add in a large transition during these periods and the stakes get even higher.
Most institutional investors know that transition management represents a unique situation in which your investment portfolio is, for a short period, an amalgamation of who you are and who you want to be as an investor. This awkward in-between stage requires a unique set of implementation skills to gracefully move from one investment strategy to another. Hence, the creation of the transition management industry, which has been aiding institutional investors with large-scale changes to their portfolios for over three decades. Cost minimization is an important part of the equation, but risk management is the most critical function in transitions.
However, for many investors, attitudes toward cost management are very different than their views on risk management. Costs are viewed as the expense to transact and should be avoided or minimized if possible. This seems perfectly logical. Risk, however, is often perceived differently—viewed more as a consequence of investing and more difficult to estimate and manage. It is this view of risk as an opaque property that can work in your favor or against that causes some investors to be less focused on risk and more fixated on controllable costs. This prioritization of cost over risk management can run counter to an investor's goal of long-term performance success.
Does the transition frame capture everything?
To understand cost and risk for the investor, we must first frame our view to align with the asset owner's perspective, which is always a time-weighted return. While trading measures like volume weighted average price (VWAP), the open, the arrival price and other frames of reference can provide attribution, they do not provide what the investor ultimately cares most about: the time-weighted performance of the portfolio over the entire transition period. If time-weighted performance is the measure, the natural next question is, what's the benchmark portfolio and when does the performance clock start and end?
The target (end-state) portfolio should always be the primary benchmark in any transition, and this has been applied across the industry for decades. When we look at the timeframe for capturing performance, this is where institutional investors see different measurements and therefore, different outcomes from transition management providers based on how the transition period is framed. Following is an example.
An institutional investor receives two post-transition performance reports for the same event. One report is T Standard-compliant. The other is not compliant with the T Standard and is called implementation shortfall.
Comparing measurement methodologies
MARKET-ON-CLOSE HYBRID MEASUREMENT DOES NOT CAPTURE ALL COSTS, WITH DAY 1 RISK AND IMPLICIT COSTS IGNORED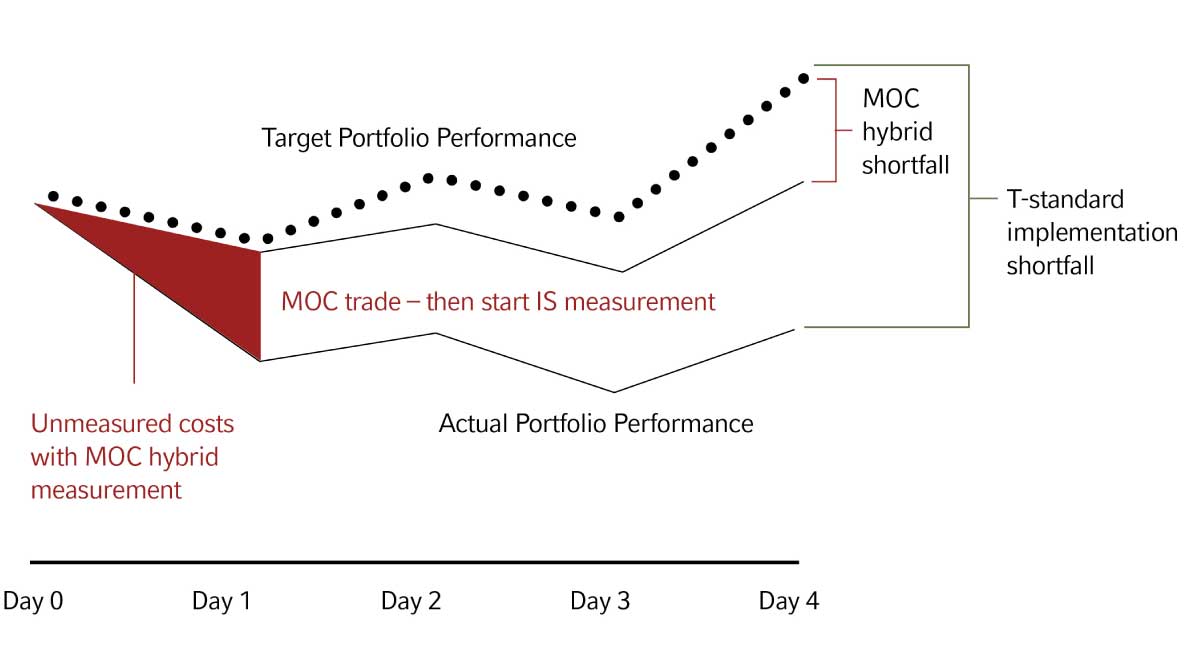 The non-T Standard measurement shows a very different picture of transition performance because it does not capture all the portfolio's time-weighted returns. When the reference prices for performance are at the same prices as your execution, the measurement loses all transparency to any opportunity risk from delays. This frame also obscures trading costs, as the market-on-close (MOC) orders will influence closing prices and, although the investor execution prices will match the reference price, the impact cost of the trade is already imbedded in that closing reference price.
This non-T Standard measurement appears to have less implementation shortfall, but in reality, this method is reporting only a subset of performance returns rather than the total return of the complete event. Unless the investor specifically requests T Standard implementation shortfall, many transition managers will report non-compliant performance, as it gives the impression of lower costs and risk. In reality, delay and transaction costs will be higher.
There are a number of reasons transition managers may avoid T Standard reporting, including:
- Many transition management providers also manage index funds and prefer to trade at end-of-day prices to match index performance. Often, these providers will delay trading for transition projects, waiting to trade MOC within their index trading process. This delay in trading can introduce more potential opportunity risk.
- Trading MOC and beginning the transition performance clock at these same closing prices avoids reporting on the opportunity gain/loss of waiting for the close. It also does not capture any impact costs the MOC trades may have incurred, as the execution price will always equal the reference price.
|
"Analyzing MOC trading costs is difficult. Traditional transaction cost modeling doesn't work for MOC strategies, and you can't compare your MOC strategy to the closing prices because you can almost always achieve that price regardless of what the costs incurred. Most transaction cost models don't account for increased flows at end-of-day paired with the dynamics of market closing auctions. However, Virtu Financial most recently has provided a transaction cost model specifically designed to analyze impact costs for the close. Their model indicated that a $1 billion EAFE basket traded at the close would cost almost 3.8bps in market impact. These costs are not observable if you benchmark your trades to closing prices and therefore framed as "zero impact" trades. However, the cost is always incurred in the performance of the investor's assets." |
- Lastly, a transition manager's estimates prior to the event will be based on the measurement methodology used in post event reporting. By reporting non-T Standard post-transition results, the transition manager can provide biased estimates that appear to be lower cost and lower risk but are in fact not accounting for all the transaction costs and opportunity risk incurred in the first day of trading. In a bidding process where investors review pre-transition estimates and select a provider based on this information, but without a standardized measurement methodology, it can be difficult to get an apples-to-apples comparison and choose the appropriate provider.
This is why the T Standard has been so critical to consumers of transition management. It provides a consistent measurement methodology that can't be gamed and views performance through the asset owner's perspective.
What's the risk of a single day?
Risk has two primary dimensions: variation and time. As investors, we take pride in looking at the long-term and not becoming distracted by short-term volatility, but transition management requires turning those attitudes on their head.
Why? Transitions are, in effect, short-term asset management assignments and a single day's performance can be the difference between a successful transition and a performance setback that can take years to earn back. The average transition trades for only three to four days, so a single day makes an enormous impact on the event. This is especially the case when that single day is the first day of the transition, when the risk characteristics are furthest from the target exposures. Importantly, applying the T Standard and measuring the risk of the first day is the only way to be aware of total risk and total costs of a transition. Even if you are unable to act on the portfolio until the end of the day, it is crucial to understand the cost of the delay and evaluate the execution cost embedded in that performance.
As we stated earlier, some transition management models rely heavily on end-of-day MOC trading, preferring to delay executions until the end of the first day exclusively. There are certain investors that may select that strategy for their transition events, focusing on potential spread and impact savings with an MOC strategy, and content to absorb the additional risk associated with the delay. Investors that frame the cost/benefit analysis in T Standard terms lean toward implementing sooner rather than later, while still using MOC trading as a tool in the course of implementation, not as the launch point for trading. Let's review an example of that trade-off between waiting for the end of the day (MOC) versus starting the trade as early as possible in a risk-managed implementation approach.
Trading immediately vs. end-of-day: Assessing the difference
In this example, consider a large global equity restructure with relatively little difference between the legacy and target. Two estimates for cost and risk are provided, with one approach that actively manages risk with immediate trading, and one approach that waits until the end of the first day to begin trading with an MOC trade.
In the table below, we compare the two estimates in a T Standard framework. While the MOC approach has a lower mean expected cost from the anticipated spread and impact savings of trading at the close, the distribution of outcomes is much wider, and therefore introduces more risk than the risk-managed implementation approach.
| MEAN COST | STANDARD DEVIATION | |
| Risk-managed implementation | -30bps | +/- 19bps |
| Market-on-close (MOC) | -26bps | +/- 38bps |
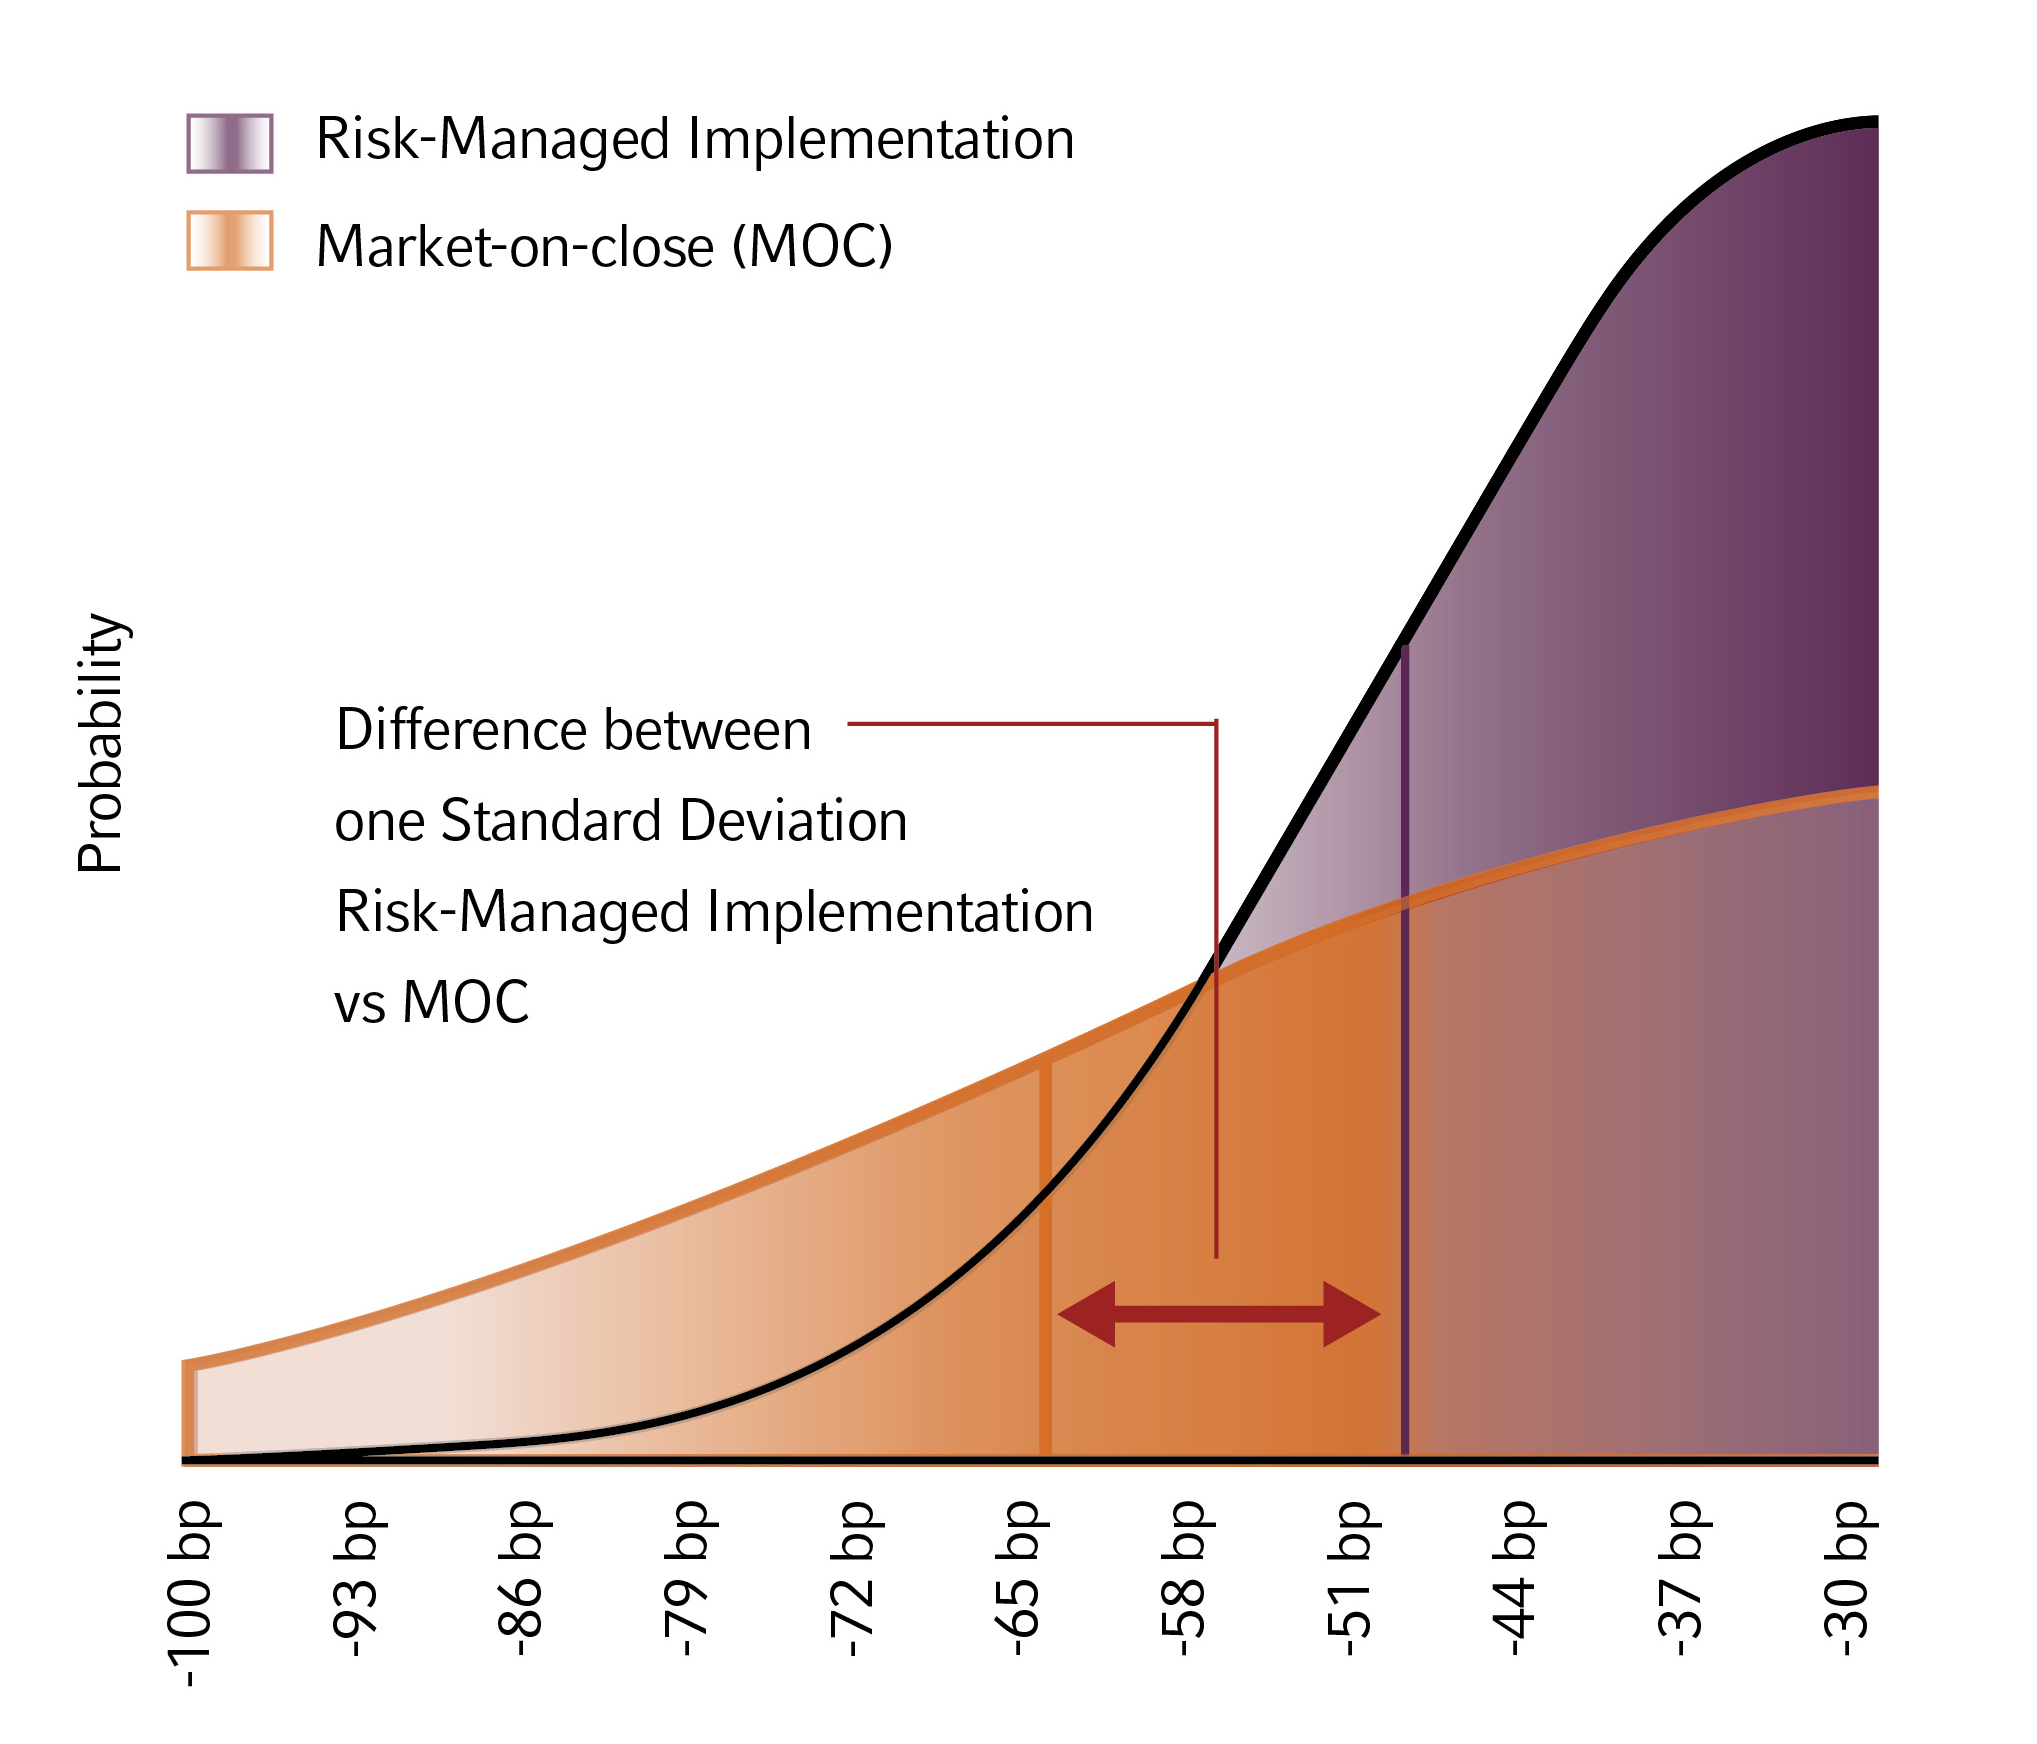
An in-depth comparison should examine what an investor's true concerns would be between these two strategies. In this case, the lower mean cost makes the MOC strategy attractive, but the MOC strategy is assuming that most trades at the close will have very low spread and impact costs. The two strategies have very different risk profiles, as the risk of waiting an entire day until the close opens the investor up to opportunity risk that can be greatly minimized in the risk-managed implementation. Because the opportunity risk can work in your favor or against, the investor is most concerned about the additional downside risk the MOC strategy has relative to the risk-managed implementation approach. The bell curves below puts the comparison into focus:
T STANDARD IMPLEMENTATION SHORTFALL
| MEAN COST | STANDARD DEVIATION | DOWNSIDE OUTCOME | |
| Risk-managed implementation | -30bps | +/-19bps | -49bps |
| Market-on-close (MOC) | -26bps | +/-38bps | -64bps |
| Risk-managed implementation vs. MOC downside outcome | -15bps | ||
Focusing in on the delta between one standard deviation (to the downside) of each strategy provides the investor with a comparative risk measure. The delta in downside outcomes (mean cost + one standard deviation) in this example is -15 bps. The MOC strategy has 15bps of additional risk at a one standard deviation measurement. The estimated savings from the MOC strategy is 4 bps (-30bps -24bps).
This allows the investor to make an informed decision on best strategy for their risk/return profile. The 4bps of potential savings will cost the investor 15bps of additional estimated risk. Is the 3X risk worth the potential savings? It depends on the investor, but most would favor the more certain outcome rather than take on three-fold the risk to receive a benefit that is, in the end, also uncertain.
However, this is not the key point of this exercise. Rather, the important argument here is that the investor needs to be aware both qualitatively and quantitatively of the risk of delay. Some of the delays may not be avoidable, while some delays may be at the discretion of the transition manager. Regardless of where the delay comes from, its impact must be measured, and that impact can only be captured with T Standard implementation shortfall methodology.
The bottom line
Only when total-portfolio performance is captured can an investor drill deeper into performance attribution and analyze how effective the transition strategy proved to be. Ultimately, we believe investors should know the full story, not a narrow-framed account of the event that represents only a portion of the results. The only best way to improve your outcomes is to have the complete picture framed appropriately, allowing the investor to know and understand past outcomes and continually improve the investment process. And it all begins with T Standard implementation shortfall.
Key takeaways
- We believe transition events should always be measured with T Standard implementation shortfall. Regardless of the execution benchmarks that may be involved in the event (MOC, VWAP, etc.), it is prudent to always obtain a complete picture of time-weighted performance by starting the performance clock at the closing prices prior to any executions. Additional attribution can provide more insight around the effectiveness of the strategy, but an investor should begin with a total-performance perspective.
- Trading at the close is not free of cost. There is an increase in volumes in global markets at closing auctions, which can reduce spread and impact costs. However, for large institutional trades, there will still be price impact at the close—and these costs should be included when analyzing MOC trading.
- Understand the trade-off between waiting (opportunity risk) and cost savings in the pre-transition process. Trading at the close can reduce spread and impact costs, but waiting to trade at market-closing prices will expose a portfolio to additional unwanted risk. Quantify the value of this additional risk, weigh it against the cost-savings benefit and make the right decision for your portfolio.