What's behind the low volatility levels in U.S. equities?
Why have the cross–stock correlations dropped and will the current trend persist in the future? Here's a contrarian perspective on possible drivers of correlation patterns in the present environment.
Because the environment in which an asset exists is almost always a major driver of risk, effective risk management must always consider and assess environmental factors along with "results" or "indicators." "Results or indicators" refer to consequential events in or measurements of the environment. In the natural environment, results/indicators include the amount and type of precipitation, temperature, flora and fauna populations and so on. Part of that assessment should include factor variation or dispersion. Returns are a major "event" for any investment and the dispersion of returns for investments is typically referred to as "volatility" and measured as a variance or standard deviation of returns. Higher volatility is commonly understood to mean higher risk.
An assessment of risk for a financial asset must occur in the context of the current financial markets environment. Today's financial markets are extraordinary across a number of key environmental indicators:
- Unprecedented monetary stimulus continues. Central bank balance sheets have grown to incredible new levels.
- Asset valuations are high by almost any traditional measure. For equities, the primary buyer has been firms buying back their own stock, often using new debt to do so.
- Leverage has reached historical highs, surpassing levels seen in previous cycles. Maturities of new debt has increased, especially for corporate debt.
- Interest rates and yields remain near all-time lows.
- Credit spreads remain very tight, also near all-time lows.
- Extremely low observed and implied volatility continues.
A reversal of any of the above indicators towards more normal historical levels will have adverse consequences on the valuations for investors. In this post, we explore the current low volatility environment using US equities.
Decomposing low volatility trend in U.S. equity
2017 will go in history books as a year with one of the lowest volatilities on record. As of end of November, YtD ex post volatility for the US large cap equities ran at 6.7%1, well below the 15–18% "rule of thumb" typically gets used for this asset class. Index returns over the same period were 18.3%, creating a Sharpe ratio of 32—definitely a historical outlier. Further, the pattern described observed for the US large cap parallels what is happening in most other risky asset classes. While it has clearly been a very favorable environment for long investors, it does raise some questions, such as:
-
- Why is market volatility so low?
- How long will it last?
- What are the implications for asset management?
A first step in forming an opinion about the future is to understand the present. In this case, understanding why volatilities are currently as low as they are.
In addressing the first question, note that the returns and volatility numbers shown above are for an equity market index. An index consists of individual equity constituents and can thus be viewed as a portfolio of stocks. For a portfolio of stocks, volatility is a function of asset allocation among its holdings, volatility of the holdings and correlation across the holdings. In a cap–weighted index, composition is usually fairly static. Thus, it is the volatility and correlations of the constituents (stocks) that ultimately determine the index volatility. Using this framework and assuming static composition, index volatility trend can be decomposed into its constituent volatility and correlation components.
For the purposes of this analysis, S&P 500 benchmark will be used. The chart below shows average pairwise correlation among S&P 500 stocks (orange line) as well as the cross–sectional distribution of the correlation coefficients represented by shaded areas on the chart.
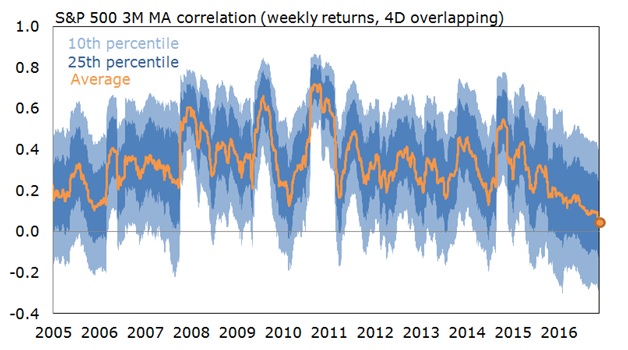
The chart above shows that average pairwise correlation in the S&P 500 index (orange line) has been declining for the last two years reaching historic lows in recent November. This trend was highlighted in a prior blog post focusing on impact of stock return dispersion on active management.
Turning now to volatility, the chart below shows ex post volatility for the S&P 500 index (orange line) and weighted average volatility of stocks in S&P 500 index (blue line).
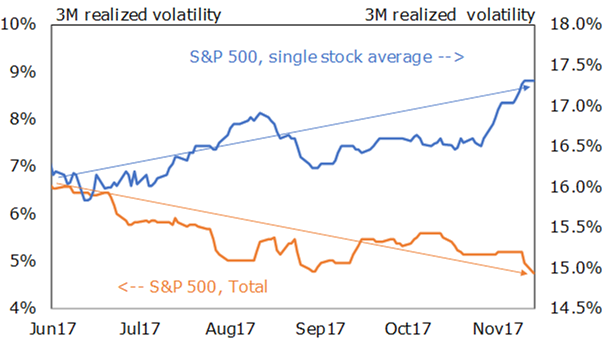
Unlike correlations, average stock volatility has been rising during the second half of 2017. Therefore, the decline in index volatility to historic lows has been driven by the historically low average correlation among its constituents.
Why does it matter whether market volatility is declining due to constituent volatility vs. constituent correlations? There are several implications related to the sustainability of the current environment as well as its impact on asset management (questions 2 and 3 from above).
While market volatility is often believed to be mean–reverting, the empirical evidence on this matter is inconclusive. There is evidence that downward mean reversion in volatility exists (i.e., if volatility is high, it is unlikely to stay there for long). The opposite is not necessarily true, however: periods of low volatility can last a very long time. The evidence for symmetrical mean reversion in correlations is much stronger. Thus, it is much more reasonable to expect that correlation will mean revert vs. having the same expectation for the constituent level volatility. Another difference between volatility and correlation patterns, is that volatility increases (i.e., an upwards mean reversion) are typically triggered by some (usually exogenous) shocks to the market. Correlations can and have mean reverted without any external catalyst.
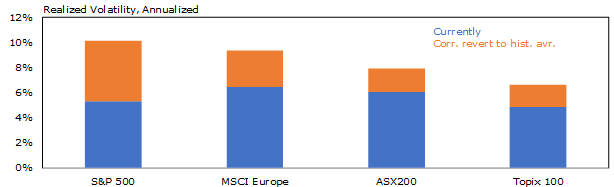
To the question of "how long will it last", the truthful answer is "no one knows". The next market regime change will most likely be triggered by some exogenous shock that is impossible to predict. Nonetheless, we can reasonably assume that correlations will eventually revert back to their historical averages. The chart below shows current level of volatility (blue bar) and volatility calculated using historical average correlations (blue + orange bar). All else equal, mean reversion in correlations would result in doubling of the US large cap market volatility (illustrated on the chart below).
The implications are that we can expect to see notably higher market volatility even in the absence of exogenous shocks. Another way to illustrate current environment is to decompose deviation from historical average volatility into constituent volatility and correlations components (chart below):
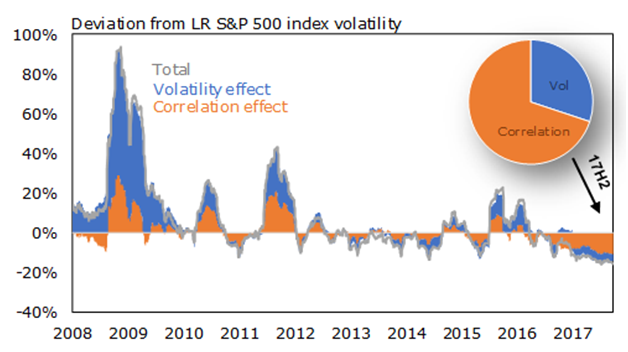
The chart illustrates that the recent dip in S&P 500 volatility has been driven primarily by the correlations component.
The last question to address is what are the implications for asset management? From perspective of active management, mechanically, the current environment is one of the most favorable combinations: low overall market risk, combined with relatively higher volatility on the single stock bets. The challenge is that the fundamental roots of the current pattern divergence are not well understood, so taking advantage of this environment is not easy. In addition, the current market mechanics work both ways: while right–way bet can be more rewarding than average, the inverse will apply to the wrong way bet. Thus, understanding why the bet is made is more important than ever.
There are also implications for traditional market risk measurements that are typically used for setting risk budgets and drive the magnitude of active bets taken. Analytics that forecast distribution of returns based on covariance matrix should be taken with a big grain of salt. Seemingly uncorrelated bets extrapolated from recent low correlation regime could quickly turn out to be more correlated than anticipated. In response to the current environment, Russell Investments risk management emphasizes the importance of stress testing and scenario analysis over the traditional market risk measures such as forecasted volatility, tracking error, beta, etc., in evaluating market risk. Overreliance on traditional measures in the current market environment will likely lead to significant understatement of the actual market risk in the portfolios. While this blog has mainly dealt with equity, the same concept applies to other asset types.
One must understand the market environment to truly assess risk. The growing popularity of factor investing and associated model–driven approaches may be influencing the dramatic decline of cross–stock correlations observed. If true, the correlations may no longer be as mean–reverting as they were before and/or mean of the correlation might have moved. Either way, it is critical to recognize how correlation can drive volatility and asset valuations. Also important is understanding why the correlations have dropped in order to form an opinion on whether the current trend will persist in the future.
2 Typical Sharpe ratios for this asset class are
These views are subject to change at any time based upon market or other conditions and are current as of the date at the top of the page.Investing involves risk and principal loss is possible. Past performance does not guarantee future performance. Forecasting represents predictions of market prices and/or volume patterns utilizing varying analytical data. It is not representative of a projection of the stock market, or of any specific investment.
This material is not an offer, solicitation or recommendation to purchase any security. Nothing contained in this material is intended to constitute legal, tax, securities or investment advice, nor an opinion regarding the appropriateness of any investment, nor a solicitation of any type.
The general information contained in this publication should not be acted upon without obtaining specific legal, tax and investment advice from a licensed professional. The information, analysis and opinions expressed herein are for general information only and are not intended to provide specific advice or recommendations for any individual entity.
Indexes are unmanaged and cannot be invested in directly.
AI-26212-01-21