Do you know where your carbon reduction is coming from?
With the ever-increasing need to decarbonize our global economy, investors are now focused not only on the why behind decarbonizing, but also the how. What do we mean by this?
3 ways to reduce a portfolio’s carbon footprint
Well, as an investor, there are three potential ways to lower the carbon footprint of your portfolio. The first is to re-allocate away from carbon-intensive sectors. In practice this could mean excluding or reducing investments in the energy, utilities and materials sectors. Alternatively, you could prioritize security selection and allocate capital to the most carbon-efficient firms within their respective sector. Finally, you could decide to hold securities and work to organically reduce their emissions over time.
These are very different approaches, and the optimal choice will ultimately depend on your investment and decarbonization goals. For example, are real world emission reductions a stated objective? If so, we see a new push for investors to place less emphasis on option 1 (reducing exposure to high-emitting sectors wholesale), and greater emphasis on achieving reductions via option 2, allocating to the most efficient firms within a given sector, and option 3, working to reduce emissions at the companies you already hold.
Why might this be the case? The sectors that bear some of the highest average carbon footprints also happen to be those sectors which are most material in deciding our global decarbonization pathway, and are therefore responsible for our success in achieving a net-zero economy. By reallocating away from these carbon-intensive sectors, investors could potentially be hindering the global energy transition.
Quantifying your portfolio’s decarbonization
While this may make intuitive sense, the real question then becomes: how do investors begin to decompose and quantify the type of decarbonization achieved by their portfolio? In their recently published paper, "Sustainability Attribution: The Case of Carbon Intensity”,1 Guido Bolliger and Dries Cornilly sought to answer this exact question. They borrowed from the widely utilized Brinson performance attribution methodology and developed a way to decompose the carbon reduction of a portfolio. By comparing the portfolio’s carbon intensity to a benchmark (the portfolio’s active carbon intensity) they were able to decompose the carbon reduction into an allocation effect, selection effect and a residual effect.
- Allocation effect: this effect can be viewed as a choice of the portfolio manager or investor to be exposed to certain themes or sectors
- Selection effect: this effect determines whether a carbon-reduction policy is followed within each sector or theme
- Residual effect: this is the remaining reduction not explained by either the allocation or selection effect and will net out to zero at the portfolio level
Of the three effects listed above, we as investors are primarily interested in quantifying the allocation and selection effects, as these will allow us to better understand whether the carbon reduction of a portfolio results from active security selection choices on the part of the manager or from sector allocation (or exclusion) decisions.
Case study: Decomposing a low-carbon fund
To help understand the benefits of this newer methodology, we decided to decompose the carbon intensity of one of our global low-carbon equity funds. The benchmark for this fund is the MSCI World Index. To begin, we first calculated the weighted average carbon intensity for each portfolio. Right away we can see that the low carbon fund has a lower carbon intensity compared to the MSCI World index.
Figure 1: Weighted average carbon intensity table
| Weighted average carbon intensity (WACI) | |
| Global low carbon equity portfolio | 71 |
| MSCI World Index | 148 |
Source: MSCI, Russell Investments
But is this simply a function of the low carbon fund investing in less carbon-intensive sectors? By decomposing the difference in carbon intensities (or the active carbon intensity) into the allocation, selection and residual effects we can see that this is far from the case.
Figure 2: Carbon attribution summary table
| Portfolio carbon intensity | Benchmark carbon intensity | Active carbon intensity | Allocation effect | Selection effect | Residual effect |
| 71 | 148 | -77 | -16 | -61 | 0 |
More than three-fourths of the carbon-intensity reduction comes from security selection within the sectors while only one-fourth is from a shift in sector allocations. We can take an even more granular view of this decomposition by looking at it on a sector-by-sector level. In an ideal world, we would want to see the selection effect show an improvement across each sector—meaning the selection effect would be negative, indicating a carbon reduction, in each sector. Why is this ideal? Because it means that the portfolio is selecting the more carbon-efficient names in all sectors. This can be contrasted to the allocation effect, which would be primarily driven by the manager’s sector tilts or by any potential sector-level exclusions applied to the portfolio. Ultimately, we would hope to see most of the carbon reduction falling under the selection effect.
Figure 3: Carbon attribution sector-level summary table
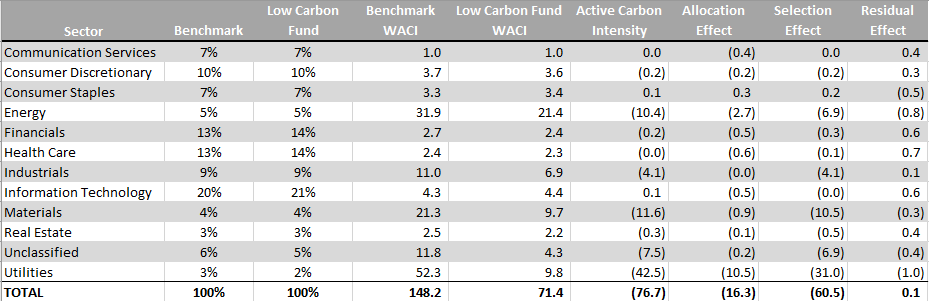
Source: MSCI, Russell Investments
By drilling down to the sector level, we see that the largest selection effect occurs within the utilities sector. This implies that the strategy is deriving most of its carbon reduction from investing in carbon -efficient utility companies. This is of particular interest given that the utility sector is critical to decarbonizing our global economy.
Can this methodology shield investors from greenwashing?
This exercise can even help investors better protect their portfolios from greenwashing. Consider, for example, a fund that points to its low carbon-intensity as proof of its sustainability focus. Further analysis, however, shows that it is achieving this via large allocation effects that offset the positive selection effects, meaning that the fund is investing in carbon-inefficient firms within each sector. This may be cause for concern for an investor looking to evidence real world emission reductions.
Conversely, this type of analysis could help explain a portfolio with a naturally higher carbon footprint. For instance, a manager might decide to invest in carbon-intensive sectors while focusing on the best performing companies, i.e., the ones who are leading the green energy transition.
The importance of working with a skilled manager
While this more granular approach to assessing a portfolio’s carbon reduction can help provide increased transparency, it is not without its own challenges. Carbon intensity, while generally a very useful metric in assessing climate-related risks, is imperfect. There may be no better example than that of companies who are involved in the mining industry. While they are crucial to the green energy transition, they generally possess high firm-level carbon emissions. This example highlights the need to work with managers who have a deep understanding of the nuances involved and can complement quantitative metrics, such as carbon intensity, or supplement additional climate-related metrics alongside carbon intensity.
Note that while we have focused primarily on carbon intensities in this blog, this methodology can be easily expanded to any ESG metric that is aggregated up to the portfolio level using a weighted average, including ESG assessments and temperature alignment scores.
The bottom line
As investors continue down their decarbonization journey, we expect the industry to focus not only on the level of carbon reductions, but also how those reductions are achieved. By utilizing this new methodology, we can better equip investors with the knowledge to answer, Do you know where your carbon reduction is coming from?
1 Bolliger, G., & Cornilly, D. (Fall 2021). Sustainability Attribution: The Case of Carbon Intensity. The Journal of Impact and ESG Investing, 93-99.