T is for tax-smart planning and investing
This is the fifth and last blog in a five-part series, discussing why Russell Investments believes in the value of advisors, based on this easy-to-remember formula:
Click image to enlarge
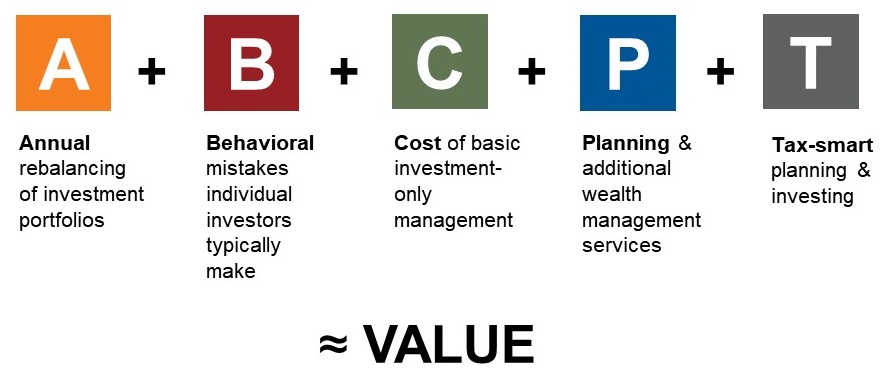
In this section, we’re talking about T, which stands for tax-smart planning and investing. Because it’s not about what the investors make. It’s about what they keep.
In 2018, 91% of all U.S. equity funds had a negative return.1 86% of all U.S. equity funds had a capital gain distribution.2 And the average gain distribution from U.S. equity funds in 2018 was 11%.3 For advisors who are tax-smart, incorporating tax management is a tremendous opportunity to help their clients keep more of what they earned.
Just how much return can be added with a tax-smart approach? The average annual tax drag for the five years ending December 31, 2018 was significant. Investors in non-tax managed U.S. equity products (active, passive, and ETFs) lost on average 2.06% of their return to taxes. Those in tax-managed U.S. equity funds forfeited only 0.54%. With taxable investors holding $8.6 trillion of the $15.7 trillion invested in open-end mutual funds, this is a massive concern—and a massive opportunity for added value.4
Click image to enlarge
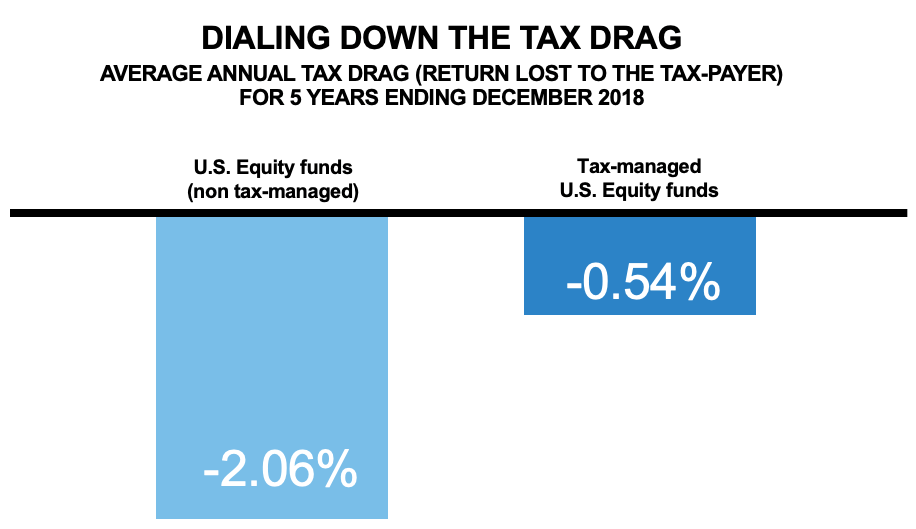
Tax-managed: funds identified by Morningstar to be tax-managed.
Universe averages*: Created table of all U.S. equity mutual funds and ETF’s as reported by Morningstar. Calculated arithmetic average for pre-tax, post-tax return for all shares classes as listed by Morningstar.
Morningstar Categories included: U.S. ETF Large Blend, U.S. ETF Large Growth, U.S. ETF Large Value, U.S. ETF Mid-Cap Blend, U.S. ETF Mid-Cap Growth, U.S. ETF Mid-Cap Value, U.S. ETF Small Blend, U.S. ETF Small Growth, U.S. ETF Small Value, U.S. OE Large Blend, U.S. OE Large Growth, U.S. OE Large Value, U.S. OE Mid-Cap Blend, U.S. OE Mid-Cap Growth, U.S. OE Mid-Cap Value, U.S. OE Small Blend, U.S. OE Small Growth, U.S. OE Small Value.
*Methodology for Universe Construction on Tax Drag chart: Tax Drag represents the average Morningstar Tax Cost Ratio for funds in each category. The Morningstar Tax Cost Ratio measures how much a fund’s annualized return is reduced by the taxes investors pay on distributions.
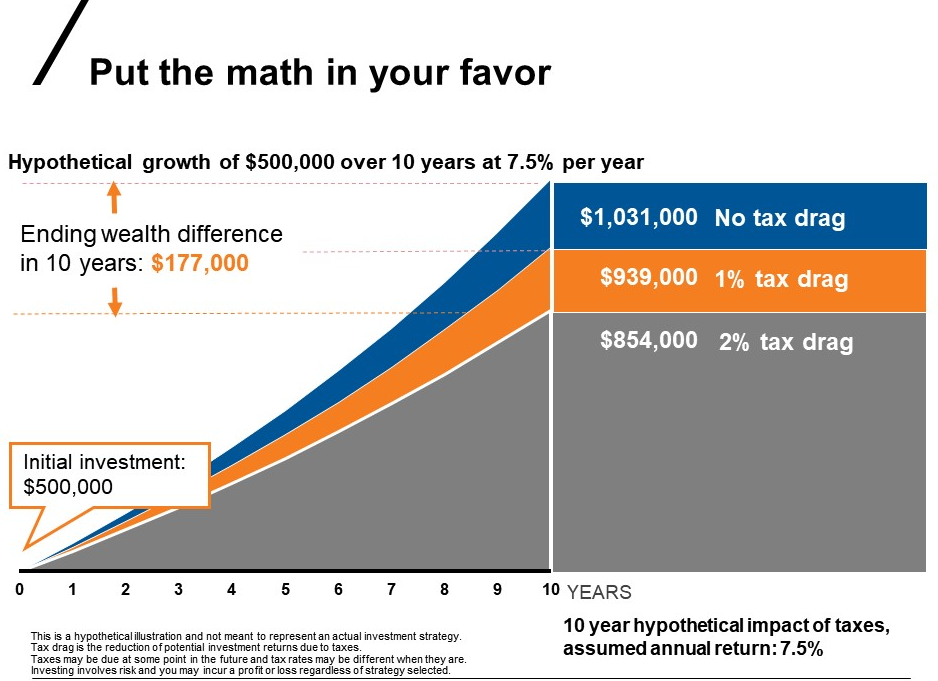
I love this next chart. Check out the value of the T here. On a hypothetical $500,000 proposal projected out ten years, with a growth of 7.5%. With no tax drag, the end value is projected at just over $1 million. With 100 basis points of tax drag possible with a tax-managed approach, the hypothetical end value is nearly a million—$939,000. But with a tax drag of 200 basis points, the end value is only $854,000. In this illustration, the hypothetical value of T over ten years is $177,000.
Click image to enlarge
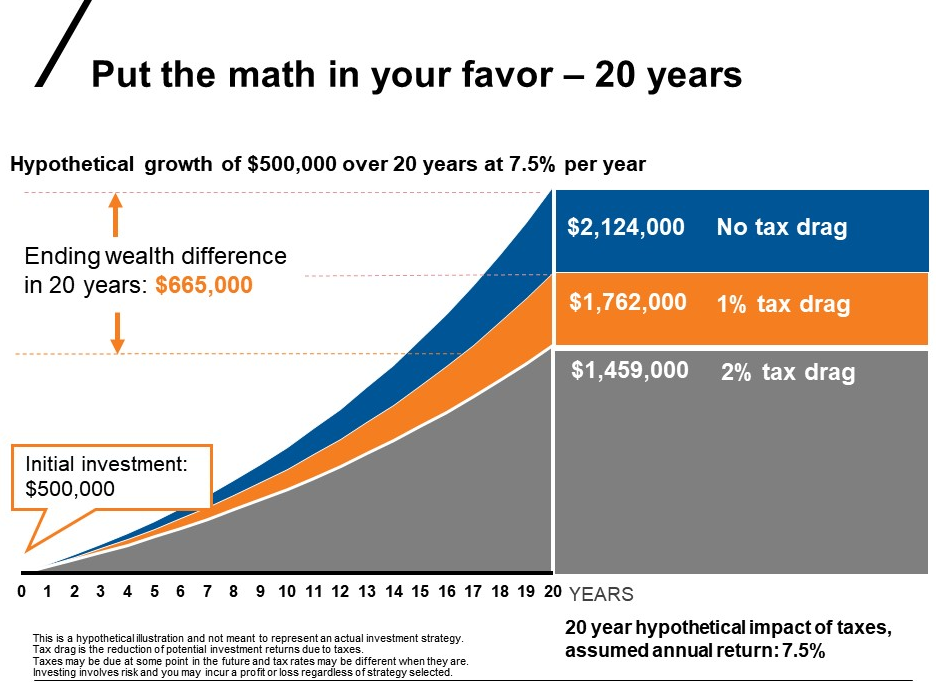
Now let’s look out even further. Over 20 years, with the same proposal and the same assumptions, the ending dollar difference—the value of T—is $665,000.
Click image to enlarge
Taxes matter. And this is a massive area for advisors to deliver value to their clients. So how are you elevating your value? How are you, as a tax-smart advisor who incorporates tax management, talking about this with your different clients? For clients who might benefit, advisors should be considering the following questions when managing for taxes:
- Do you KNOW each client’s marginal tax rate?
- Do you PROVIDE intentionally different investment solutions for taxable and non-taxable assets?
- Do you EXPLAIN to clients the benefit of managing taxes?
- Do you HAVE a process for partnering with local CPAs?
- Do you REVIEW your client’s 1099?
A forensic review of the 1099 form
Doing a forensic review of the 1099 can be really eye opening. Looking at the 1099 really connects the dots between what a client makes and what a client actually keeps. And the tax process sometimes buries that a little bit. Clients don’t necessarily connect what they are paying with what they are investing, because of the complex forms required by the IRS. This is an opportunity for advisors to shine. Simply walking through the 1099 and discussing insights, implications and income impact for clients can be truly beneficial. On their own, clients are unlikely to connect the dots between dividend distribution impact on their total wealth return. You, the advisor, can reveal what they may be sacrificing to taxes. And better yet, you can do something about it. A tax-managed approach may help you provide a significant reduction in tax drag between one year and the next.
Communicate your value
This is the final section of our 2019 Value of an Advisor series. But all this demonstrated value that we’ve discussed in this blog post, in the series and in the full report, can go unnoticed by your clients without one vital action on your part: communication.
Advisors need to communicate the value they provide to their investor clients. Communication, as an academic discipline is deceptive, because everybody thinks they’re good at. But for most advisors, we have found that the quality of their communication would benefit for greater effort and greater intentionality. After all, your value is only as good as the client experience that you are reliably delivering, clearly communicating, and constantly elevating.
So then, what are you going to do to elevate your value? We believe a tax-smart approach might be your best place to start.
Related articles:
Tax-managed investing 101: Understand the basics and slay the beast
2019 capital gain distributions: Are you letting history repeat itself?
Your words matter! Especially when it comes to TAXES.
The function of the form: What advisors need to know about the new form 1040
Do you know how to calculate after-tax returns?
Five key ways advisors deliver value in 2019
Is a financial advisor worth the cost?