Confessions of a portfolio manager: Preparing for a market crash
Crashes exist precisely because they are unexpected. Today, Senior Portfolio Manager David Vickers confesses that trying to predict and time the precise future is somewhat futile. We know only one future will come to pass, but as we sit here today, many are possible.
Only one future will come to pass, but many are possible
Prepare, don’t predict
Surprises happen when you least expect them to—and that means that I, like many other managers, won’t be able to take down risk assets the day before the next crash. What I do aim to do however, is prepare and protect my portfolios as the probabilities of surprises, or rather, crashes, rise.
I always get asked by journalists during an episode of weakness, What are you doing? I tell them that if it relates to a known event, like a referendum or an election, then the real question should be, What did you do ahead of the event? That’s because it’s what a portfolio manager does ahead of a market changing event that will determine success. The ability to successfully react and take profitable action after the event becomes smaller and smaller as time passes.
I’m convinced I foresaw the dot-com crash
Market declines are always obvious with hindsight. I’m sure we’ve all seen Michael Lewis’ The Big Short and sat there nodding sagely or screaming at the TV saying, come on! Well—and I’m probably going to surprise you here with another confession—I genuinely believe that I saw the tech/dot-com crash of 2000.
Pre-crash mania
I was only a number of years into my career at that stage, still a text book analyst and very naive. I couldn’t understand why companies with no earnings were valued at crazy multiples and had risen by hundreds of percent. I also clearly remember the mania—everyone was taking stock tips from the contracts clerk who was mining tech tip sheets. Even dissenting senior portfolio managers were getting swept away for fear of missing out. However, calling the end and timing the end are two different things, and to be honest, I didn’t call time on the end, but I did think that things were crazy. I recognized something wasn’t right.
The trigger? Boo.com
To me, the end of the bull market happened when boo.com went bust. You may remember it was an internet retailer… Or rather, you probably won’t remember because at that time, only 20% of us had the internet and even fewer still had the speed necessary to be able to make the site function! When it went under with a cash burn of $1 million a month1, people woke up and the penny dropped. That’s when the selling started.
Despite our efforts, crashes keep happening
And they will continue to happen …
Crashes exist precisely because they are unexpected and cannot be forecasted in a very timely manner. At the crux of this debate is that every bear market is different. Soul searching, regulation and legislation is imposed after each episode, but crashes keep happening. Models are developed to perfectly spot (with hindsight) the last crash, but often the focus point is then not actually correct for the next crisis. The global system is complex and dynamic, and so I’m confident that the next crash will result from a separate set of vulnerabilities. That said, the lessons of history are not to be dismissed out of hand. At Russell Investments, we look at valuations and economics to help us prepare.
Consider valuations—they always mean something
Despite changes in the global system, expensive valuations should still be considered as a warning sign. Today, Schiller’s cyclically adjusted price-to-earnings ratio (CAPE) remains the highest it’s been in over 15 years at 32.70%.2 This indicates the U.S. equity market is currently highly overvalued. It begs the question—is this the end of the bull market? How much further can the U.S. equity market go? While CAPE is not a short-term timing tool (according to Professor Schiller’s own admission), it does help us to shape our expectations for the future. It narrows the funnel of doubt.
Consider economics—vulnerability and resilience depend on the health of the economy
Does studying the economy really work when it comes to preparing for a crash? Well, yes and no. Correctly guessing the economic data itself plays a smaller role than some may think, but its study is not wasted as the vulnerability of markets to a shock does depend on the health of the economy. So, monitoring debt levels, leverage and consumption rates, among other metrics, can prove to be useful.
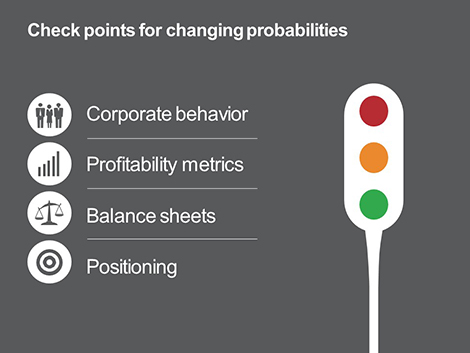
The key? Use check points for changing probabilities
Four main indicators
- Corporate behavior – Mergers and acquisitions, initial public offerings and buy-backs are always good to keep an eye on.
- Profitability metrics – We run multiple analyses to help us consider whether the corporate profit peaks have been reached, or are close.
- Balance sheet and credit metrics – High debt levels are rarely a good thing!
- Positioning – Knowing where you are in the crowd is a very useful thing. We survey how other managers are positioned to ascertain what the herd is saying.
All these things provide what I like to call the kindling or the fuel for a bear market. But, the list isn’t exhaustive. Something is missing, i.e., the spark to ignite the fire is needed—and it's this that's most difficult to predict, like Boo.com or Lehman’s going bust.
My final confession today: There is no perfect answer
Having an awareness of the lessons history can teach us is instrumental in helping to prepare for the next bear market. This helps us give an indication toward what needs to be monitored. Stress-testing portfolios regularly at the points of most fuel, and leaning away from expensive assets while being mindful of the dangers, can significantly mitigate the losses when they arrive unexpectedly.
It’s likely that we won’t spot the turning point, and this is a fact that should be accepted. But, we believe that a good process should have investors leaning out of risk assets as returns come down and risks rise.
1 Source: https://www.nytimes.com/2000/05/19/business/international-business-boocom-online-fashion-retailer-goes-out-of-business.html