Is this funding stabilization or funding stagnation?
Tracking when/if funding requirements will be close to mark-to-market again.
When the Pension Protection Act (PPA) was passed in 2006, one of key tenets was to measure the funding of pension promises more accurately by reducing the smoothing of assets and liabilities. While some relatively brief 24-month smoothing was still permitted under PPA, contribution requirements were generally designed to fully fund a plan's accrued benefits in seven years on a nearly mark-to-market basis. Logic held that appropriately measuring pension obligations and requiring plan sponsors to fully fund their DB plans on this basis would improve the security of benefits for plan participants. This would also help safeguard the Pension Benefit Guaranty Corporation (PBGC) from excessive distressed terminations that could jeopardize its financial stability.
Now, looking back fourteen years, we might question PPA's effectiveness. Since PPA funding rules began to apply in 2008, some form of funding relief to mitigate the impact of mark-to-market requirements has been in effect practically every year.
Not long after PPA's effective date, the Global Financial Crisis (GFC) wreaked havoc on DB plans and their sponsors. The crisis hurt the financial position of many plan sponsors at a time when contribution requirements would jump. Relief measures from the IRS and Congress began pouring in over the next few years, each relatively short-lived and with mixed effectiveness.i Despite strong asset performance in the years following the GFC, funded status did not meaningfully improve due to declining interest rates, and higher contribution requirements always seemed on the horizon for plan sponsors.
i Funding relief measures included the Worker, Retiree, and Employer Recovery Act of 2008 (WRERA) and the Pension Relief Act of 2010 (PRA). Also, in early 2009 the IRS allowed the use for spot rates instead of 24-month averages, allowing plan sponsors to take advantage of abnormally high discount rates present in late 2008.
Funding relief in the corridors
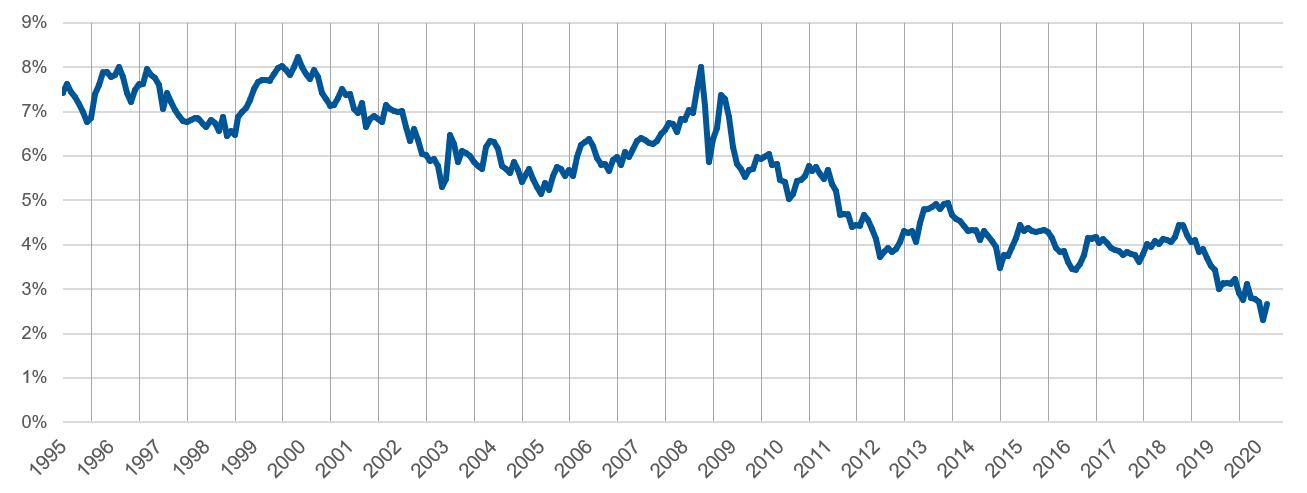
Following the GFC, pension discount rates declined precipitously. Before 2008, mark-to-market pension discount rates were 6-7%. By 2010, discount rates had fallen below 6%, then below 5% in 2011, and finally under 4% in 2012. Each large decline in discount rates led to a sharp rise in liabilities, which translated to higher contribution requirements. Over the course of 2-3 years, pension discount rates dropped by over 200 basis points, leading to a liability increase of 25-30% for most DB plan—a challenging hurdle for sponsors to overcome.
FTSE Pension Liability Index
(Click to image enlarge)
In response, and at the urging of many large DB sponsors (and some actuarial firms), Congress passed a new kind of funding relief that was intended to stabilize discount rates and anchor them to a corridor around a 25-year average of rates. Given how much higher rates were in the 1980's, this would lead to using a much higher discount rate than spot rates at the time would imply. Using these rates would reduce accrued liabilities and make contribution requirements both lower and more predictable. This relief was provided irrespective of the sponsor's ability to pay unreduced required contributions.
The passage of this bill—MAP-21ii —in 2012 ushered in an effective dismissal of mark-to-market funding requirements that was stated at the time as temporary. The effects of this bill were intended to phase out within 5 years (through expansion of the corridor), but two future bills—HATFA in 2014 and BBA in 2015iii—extended the effects of "funding stabilization" eight more years and created uncertainty as to if and when funding rules would truly revert back to mark-to-market. They provided substantial relief to plan sponsors feeling the pinch of contribution requirements, but was there a long-term cost to this relief?
ii Short for "Moving Ahead for Progress in the 21st Century Act."
iii HATFA is short for "Highway and Transportation Funding Act of 2014" and BBA is short for "Bipartisan Budget Act of 2015."
The PBGC premium problem
The other side of the double-edged sword of funding relief was PBGC premium increases. Ostensibly to offset other federal expenditures, PBGC premium rates began to skyrocket after 2012. While this has substantially buoyed the financial position of the single employer PBGC program, it has exacerbated the effects of sponsors not being required to fund their plans to mark-to-market levels. This is because the variable portion of PBGC premiums—based on the plan's unfunded vested liabilities (on a mark-to-market basisiv)—has increased to nearly five times its 2012 rate.
iv This basis is either current spot rates (standard method) or 24-month average (alternative method) rates, as elected by the sponsor.
These premiums have become a tax on underfunded plans, requiring them to pay nearly 5% of their funding deficit to the PBGC each yearv. This has become a strong headwind to improving funded status as the premiums (usually paid from plan assets) reduce plan assets without changing plan liabilities. They effectively offset a portion of the plan's hard-earned investment gains.
v Based on vested liabilities, and subject to per-participant premium caps.
The DB drawdown effect
The more poorly funded the plan is, the more challenging it is to become fully funded again. The cost of delaying contributions now could be more than just paying an equivalent amount of contributions in the future. In addition to the PBGC premiums, an important factor called "benefit payment drag" affects sponsors.
Benefit payment drag occurs when the sponsor of an underfunded DB plan pays out benefit payments, and the funded ratio declines. For example, let's say a DB plan has $100 million in liabilities and $80 million assets ($20 million deficit and 80% funded). They pay $10 million in benefit payments, leaving them with $90 million in liabilities and $70 million in assets ($20 million deficit and 78% funded). While the deficit remains the same, their funded ratio has declined, and they have less capital on which to earn liability-relative investment returns. This forces the sponsor to depend more on future contributions to fund their plan. Sponsors can mitigate this effect by funding their plans earlier.
Contributions are king
Despite stellar equity returns over the last decade, funded status for many sponsors has either stagnated or fallen. Many sponsors have found it quite challenging to overcome the effects of declining discount rates (which have now dropped below 3%) and increasing PBGC expenses. The sponsors that have chosen to make discretionary contributions (above the minimum) have seen the most consistent improvement.
While sponsors are always free to contribute above minimum contribution requirementsvi, some sponsors will choose to maintain a funding policy of simply paying the minimum, even if the sponsor could afford to contribute. The unfortunate reality is that paying the minimum has not led to improved funded status since 2012. While funding relief offers sponsors flexibility, it should not be mistaken for an adequate funding strategy over the long term.
vi Subject to maximum deductible amounts…but those are so high they no longer pose a barrier to almost any sponsor.
When will funding relief wear off?
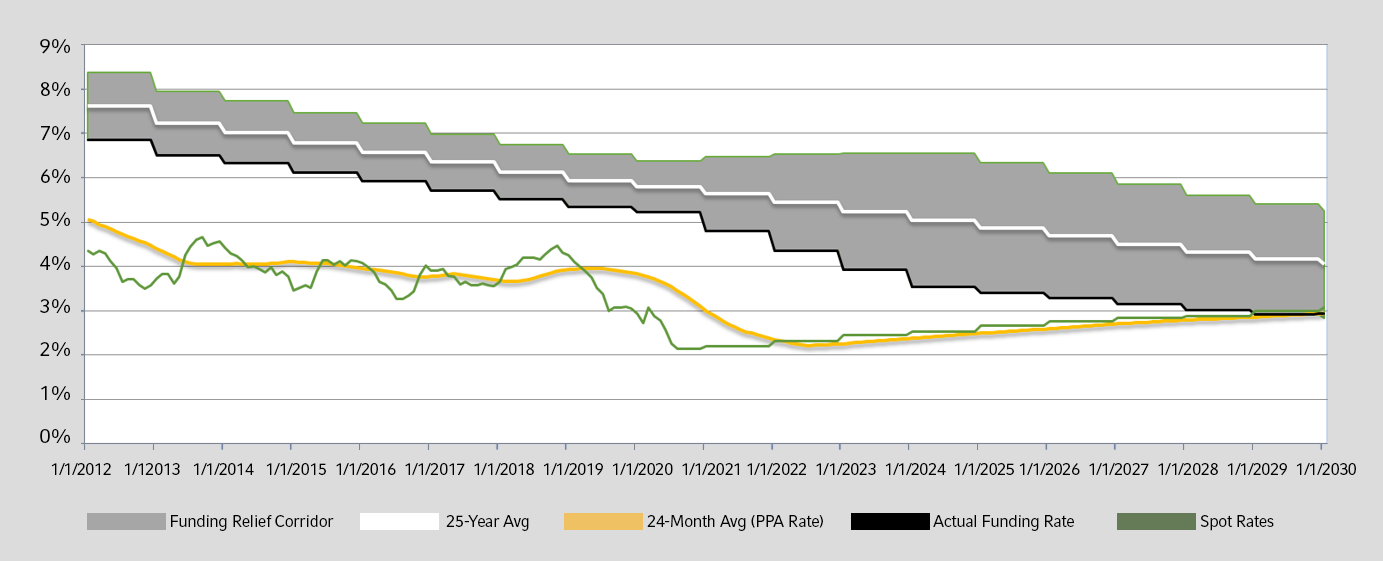
A few factors contribute to this, most importantly the use of and the size of the corridor around the 25-year average, and the pattern of future interest rates. Since 2012 the funding discount rate has been 90% of the 25-year average (the lower end of the 90%/110% corridor), with this range expanding by ±5% in 2021 until it reaches 70%/130% in 2024.
This expansion goes a long way to bring down funding rates, but since actual spot rates have fallen so dramatically over the last 18 months, we are nowhere near the two converging. Just last year, we anticipated a convergence within 3-4 years, but if spot rates follow the forward rates implied in the market, it could be 8-9 years before the lower end of the corridor aligns with the 24-month average used for funding purposes.
Funding Stabilization Interest Rates (segment 2 only)
(Click to image enlarge)
Further funding relief on the horizon?
Despite the existing funding relief in place, proposals have been made to extend relief further, given how much funding rates have declined since 2012. Proposals to enhance funding relief include maintaining the 90%/110% corridor for five more years, narrowing the corridor to 95%/105%, or even putting in place a fixed floor on funding discount rates.
Sponsors will likely welcome any extension of funding relief and the additional financial flexibility provided. However, sponsors should also be cautious of adopting a funding policy linked purely to minimum requirements as PBGC premiums and other costs of underfunding continue to grow with time.