Equity Factor Report – Q3 2023: Value strategies rally as bullish sentiment dampens
Executive summary:
-
In Russell Investments’ factor portfolios, the Value factor outperformed the MSCI All-Country World Index during Q3, while the Growth, Momentum and Low Volatility factors underperformed the index.
-
In Q3, the strongest performance among factors was seen in developed ex-U.S. large cap and small cap and U.S. small cap, where Value outperformed by 4.9%, 3.3% and 3.3%, respectively. The weakest performance among factors was in U.S. small cap, where the Size factor underperformed by -2.4%.
-
Allocating capital from crowded securities to those that are less crowded can benefit factor returns.
Overview
Global markets in Q3 2023 were characterised by a decline in bullish sentiment that had lifted stocks out of a bear market in the first half of the year, with the MSCI ACWI Index declining by 3.3% in the third quarter. Investors were increasingly confident that a recession was not coming this year, but as the quarter progressed, the rate cuts penciled in for 2024 started to look unlikely even though signs continued to point to inflation pressures easing in the coming months. This led to a retreat among the magnificent seven stocks that had provided the market with most of its gains in prior months. Instead, energy stocks were the best performers due to the rise in oil prices. The MSCI Emerging Markets Index lost less (-2.8%) than the U.S. and MSCI World ex-US Indices (-3.15% and -4.02%, respectively).
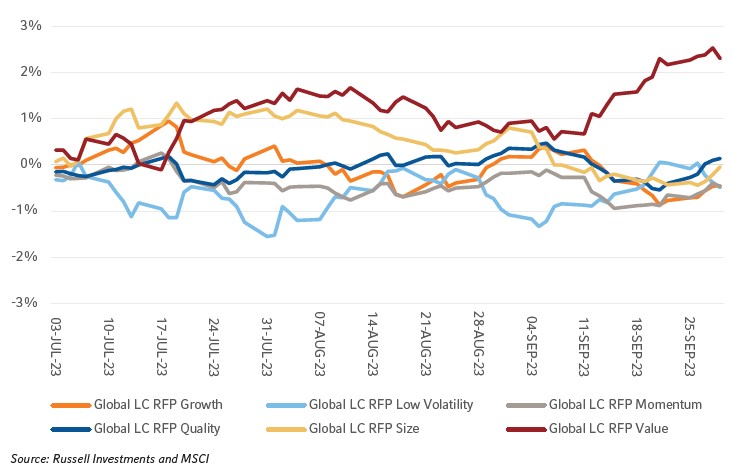
When considering Russell Investments' factor portfolios (RFPs), the global large cap Value outperformed the MSCI ACWI, yielding positive excess returns of +2.3%. Conversely, the global large cap Growth, Momentum, and Low Volatility portfolios underperformed, all experiencing slightly negative excess returns of -0.5%. The global large cap Size and Quality portfolios remained flat throughout the quarter.
Figure 1: Cumulative excess returns for Global RFPs vs. MSCI ACWI (03/07/2023-30/09/2023)
Factor Performance
Global RFPs performance dynamics
The performance dispersion among Global RFPs this quarter was quite minimal, with a slight uptick noted in the first half of September. During that period, Value and Low Volatility began to show better performance, while all the rest of the factors started to lag. Value performance was the strongest in July and September.
Performance dynamics
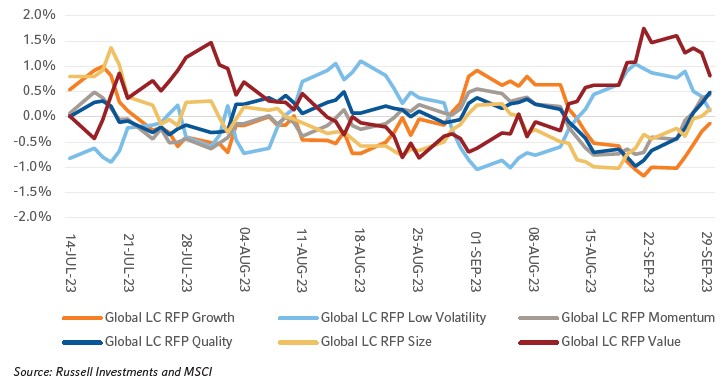
The performance dispersion among Global RFPs this quarter was quite minimal, with a slight uptick noted in the first half of September. During that period, Value and Low Volatility began to show better performance. All the rest of the factors started to lag.
Figure 2: 10-Day rolling excess returns for Global RFPs vs. MSCI ACWI (03/07/2023-30/09/2023)
RFPs’ performance across regions
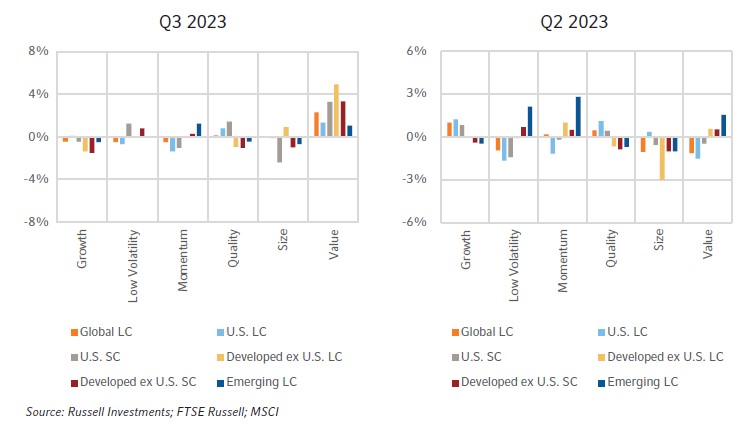
In the third quarter of 2023, the performance of the factors was more consistent across the regions than in the previous quarters. The Value factor outperformed while the Growth factor slightly underperformed in all the regions. The performance of Low Volatility, Momentum, Quality and Size was mixed in terms of direction but with low dispersion. The strongest performance among factors was seen in developed ex-U.S. large cap and small cap and U.S. small cap, where Value outperformed by 4.9%, 3.3% and 3.3%, respectively. The weakest performance among factors was in U.S. small cap where the Size factor underperformed by -2.4%.
Figure 3: Excess returns of RFPs vs. corresponding benchmarks (Q3 2023 and Q2 2023)
Performance of subfactors in the global universe
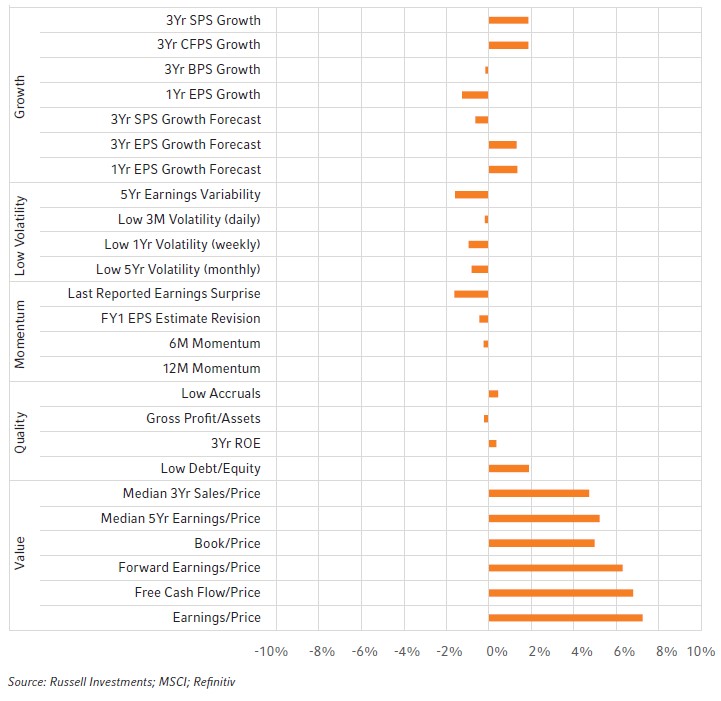
Figure 4 below illustrates the performance of various subfactors in the MSCI ACWI universe for the last quarter, represented by top minus bottom quintile portfolios1. All Value subfactors outperformed in Q3 while most Low Volatility subfactors underperformed. The performance of other subfactors within factor groups was mixed. Earnings-to-Price showed the strongest performance (+7.2%), while Last Reported Earnings Surprise and 5-Year Earnings Variability were the weakest (-1.6% for both).
Subfactor performance
All Value subfactors outperformed in Q3 while most Low Volatility subfactors underperformed. The performance of other subfactors within factor groups was mixed. Earnings-to-Price showed the strongest performance (+7.2%) while Last Reported Earnings Surprise and 5 Year Earnings Variability were the weakest (-1.6% for both).
Figure 4: Performance of cap-weighted top-minus-bottom quintiles (Q3 2023)
Ex-ante correlations and active risk of Global RFPs
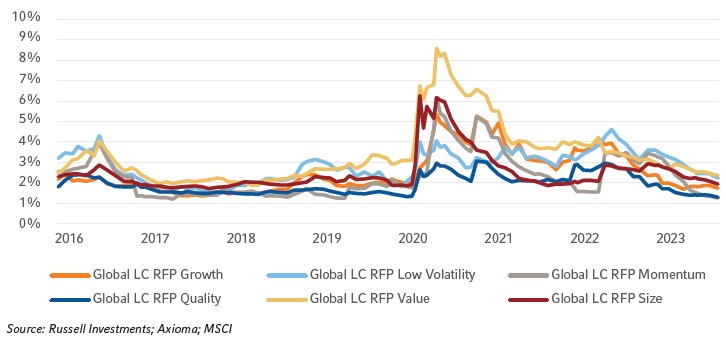
The correlation structure has seen a couple of adjustments since June 2023, as illustrated in Figure 5 below. In particular, the correlation between global large cap Momentum RFP and global large cap Low Volatility RFP has continued to decrease, indicating the shift in relative performance of the Low Volatility factor. Additionally, the previously observed negative correlation between global large cap Value and global large cap Low Volatility has now changed to slightly positive. Despite these shifts, the rest of the correlation estimates have largely remained stable, with no significant changes. Moving forward to Figure 6, the ex-ante active risk levels—predictive measures of the active risk associated with factor portfolios—have maintained a consistent downward trajectory, signaling a return to normal in the active riskiness of these portfolios.
Ex-ante correlations and active risk
The correlation between Global LC Momentum RFP and Global LC Low Volatility RFP has continued to decrease, indicating the shift in relative performance of the Low Volatility factor. Additionally, the previously observed negative correlation between Global LC Value and Global LC Low Volatility has now changed to slightly positive. The ex-ante active risk levels—predictive measures of the active risk associated with factor portfolios—have maintained a consistent downward trajectory, signaling a return to normal in the active riskiness of these portfolios.
Figure 5: Ex-ante correlations with Global LC Low Volatility RFP (01/2016-09/2023)
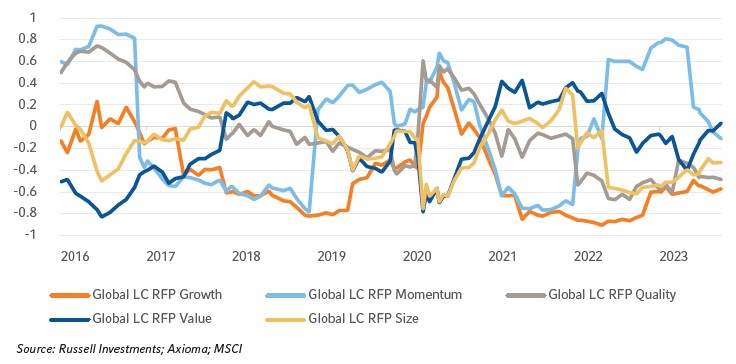
Figure 6: Ex-ante tracking errors of Global RFPs (01/2016-09/2023)
Spotlight on: Crowdedness in equity factors
Crowdedness in equity strategies refers to the extent to which a particular trade or strategy is populated by investors. A crowded trade occurs when a large number of participants adopt similar positions, which can lead to amplified market reactions when these positions are unwound. One commonly used metric to gauge crowdedness is short interest.
Short interest refers to the number of shares of a particular stock that have been sold short but have not yet been covered or closed out. High short interest can indicate that a significant portion of investors are betting against a stock, making it a potentially crowded trade. Short interest can be a signal of the market's sentiment about a stock's future performance. A rise in short interest might imply growing negative sentiment. High short interest relative to the stock's trading volume can lead to a short squeeze. This happens when short sellers rush to cover their positions due to an upward price movement, further driving up the stock's price.
Measuring crowdedness in factor portfolios is crucial for two reasons: risk management and liquidity concerns. Crowded trades can unwind rapidly, leading to significant losses, and highly crowded trades can face liquidity issues when many investors head for the exit simultaneously, leading to a sharp price drop. For example, in the late 2000s, many investors crowded into the momentum trade, specifically tech stocks, leading to the dot-com bubble's eventual burst. In addition, historically, stocks with exceptionally high short interest have seen abrupt price surges, known as short squeezes. For instance, the GameStop frenzy of early 2021 was fueled in part by its high short interest, leading to rapid price appreciation as shorts rushed to cover.
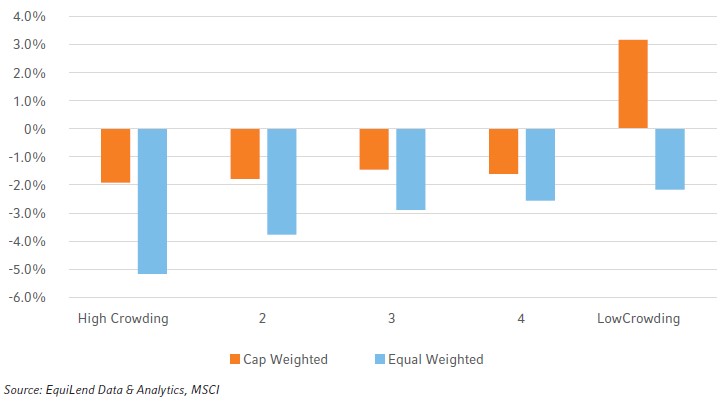
For the analysis below, we built a research version of a crowding factor using EquiLend Data & Analytics’ utilisation ratio to study its characteristics. We calculated the performance of cap-weighted and equal-weighted quintiles, using the MSCI ACWI Index, that are ordered by low to high utilisation ratio for the March 2013 to September 2023 sample period.
In Figure 7, we show the annualised excess returns of the crowding factor quintiles. We see that the quintile making up the securities with the lowest utilisation ratio score is the only bucket to have positive excess returns when cap weighted.
Figure 7: Annualized excess returns of the crowding factor vs MSCI ACWI (01/04/2013 to 30/09/2023)
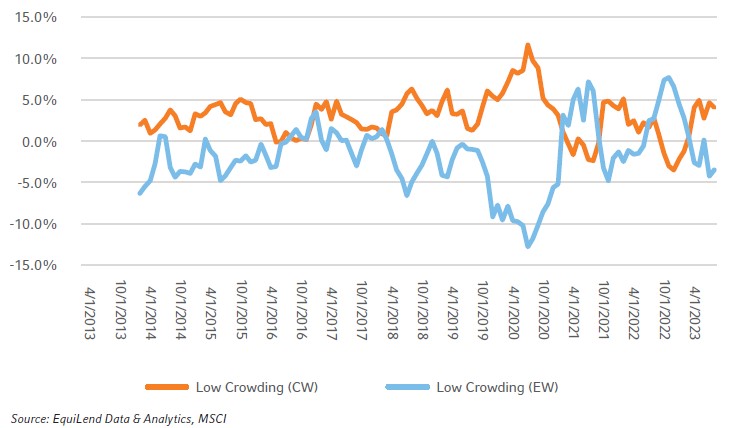
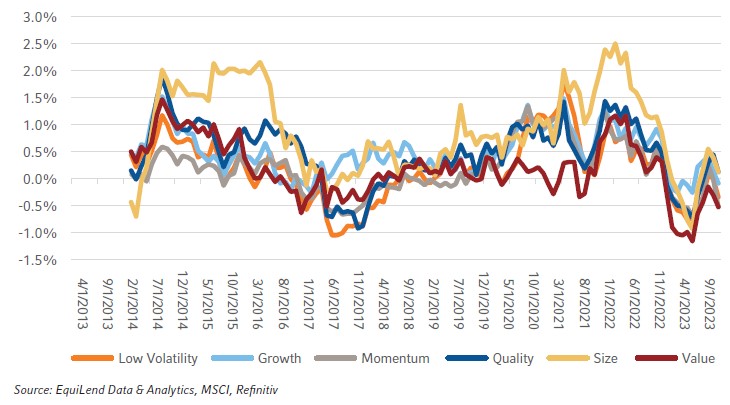
In Figure 8, we show the rolling 1-year excess returns of the cap-weighted top quintile (least crowded) and an equal-weighted top quintile that removes the size effect. Once the size effect is removed, the equal-weighted top quintile underperforms the benchmark over the sample period. We surmise that the outperformance of the top quintile with cap weighting is being driven by the size effect and not because of the crowding factor itself. This implies that the crowding factor can be utilized more effectively by avoiding securities with the highest utilisation ratio rather than being long securities with the lowest utilisation ratio.
Figure 8: Rolling 1-year excess returns of the cap-weighted and equal-weighted top quintile of the crowding factor based on MSCI ACWI (30/09/2013-30/09/2023)
We test this approach by looking at Russell Investments’ factor portfolios and exclude securities that are the most crowded—those in the bottom quintile. Figure 9 shows the difference between the factor portfolios that apply the exclusion vs. the live model over one-year rolling periods. On average, applying a crowding filter was a net positive over this sample period, but the magnitude of the improvement varied across factors. On an annualised basis, the Size factor had the biggest improvement with 85 basis points (bps), then Growth at 50 bps and Quality with 45 bps, followed by Low Volatility, Value and Momentum at 19, 18 and 17 bps, respectively.
Figure 9: Difference in 1-year rolling excess returns of Russell Investments Factor Portfolios using a crowding filter vs. without a crowding filter
This preliminary analysis over a limited sample period shows that implementing a crowding factor that is long only can be difficult. However, taking into account the short side and avoiding names that are the most crowded can improve factor premiums by allocating your capital into securities that are less crowded and capturing a better premium.
The Bottom line:
-
Russell Investments’ Value portfolios outperformed the MSCI ACWI benchmark while Growth, Momentum and Low Volatility portfolios underperformed.
-
The correlation between global large cap Momentum RFP and global large cap Low Volatility RFP decreased, while the global large cap Value and global large cap Low Volatility shifted to slightly positive.
-
Allocating capital from crowded securities to those that are less crowded can benefit factor returns.
1Top minus bottom cap-weighted quintile portfolios are not investible and are used to proxy the performance of the subfactors used in the construction of RFPs. RFPs are long only portfolios.