Equity Factor Report – Q4 2023: Growth strategies rally on the prospect of lower interest rates
Executive summary:
- In Russell Investments’ factor portfolios, the Global Large Cap Growth, Momentum and Size factors outperformed the MSCI All-Country World Index during Q4, while the Global Large Cap Value and Low Volatility factors underperformed the index. The Global Lage Cap Quality factor was flat for the quarter.
- In Q4, the strongest performance among factors was seen in U.S. Large Cap, where Growth and Momentum outperformed by 1.4% and 0.9%, respectively. The weakest performance among factors was in Developed ex-U.S. Large Cap, where the Value factor underperformed by -2.9%.
- Historically, the Momentum and Quality equity factors have been the strongest performers during periods of monetary easing, while the value and size factors have been the weakest.
Overview
Buoyed by the prospect of lower interest rates, global markets in Q4 2023 were characterized by a rally in technology companies, with the MSCI ACWI Index gaining by a robust 11.2% in the fourth quarter. During the quarter, investors became increasingly confident that inflation was no longer a threat and that lower interest rates were on the horizon. As the quarter progressed, and the prospect of a U.S. Federal Reserve (Fed) pivot took hold, technology stocks led by the Magnificent Seven rallied into the end of the quarter. Energy stocks, which were among the best performers in Q3, lagged in Q4. The MSCI Emerging Markets Index gained less (+7.9%) than the U.S. and MSCI World ex-U.S. Indices (+12% and +10.6%, respectively).
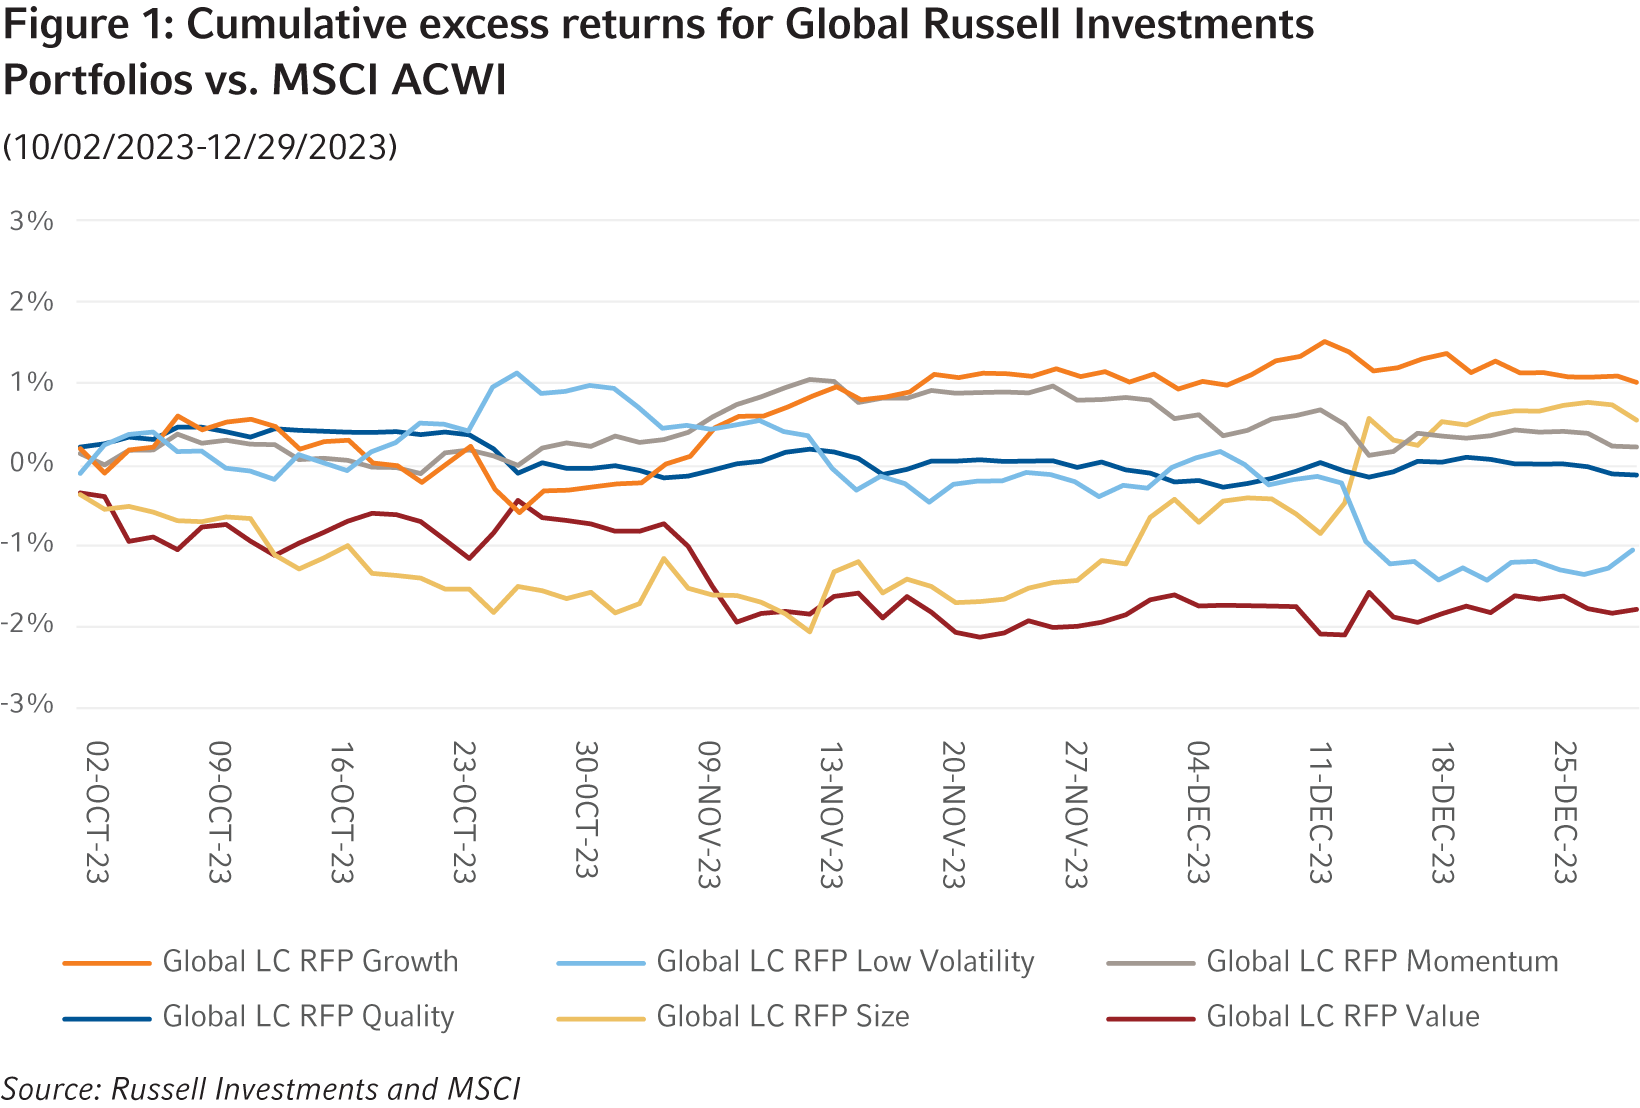
When considering Russell Investments’ factor portfolios (RFPs), the Global Large Cap Growth, Momentum and Size outperformed the MSCI ACWI, with positive excess returns of +1%, +0.2%, +0.6%, respectively. Conversely, the Global Large Cap Value portfolio underperformed by -1.8%, along with Low Volatility, with an excess return of -1%. The Global Large Cap Quality portfolio remained flat for the quarter.
Factor performance
Global Russell Investments Factor Portfolios’ performance dynamics
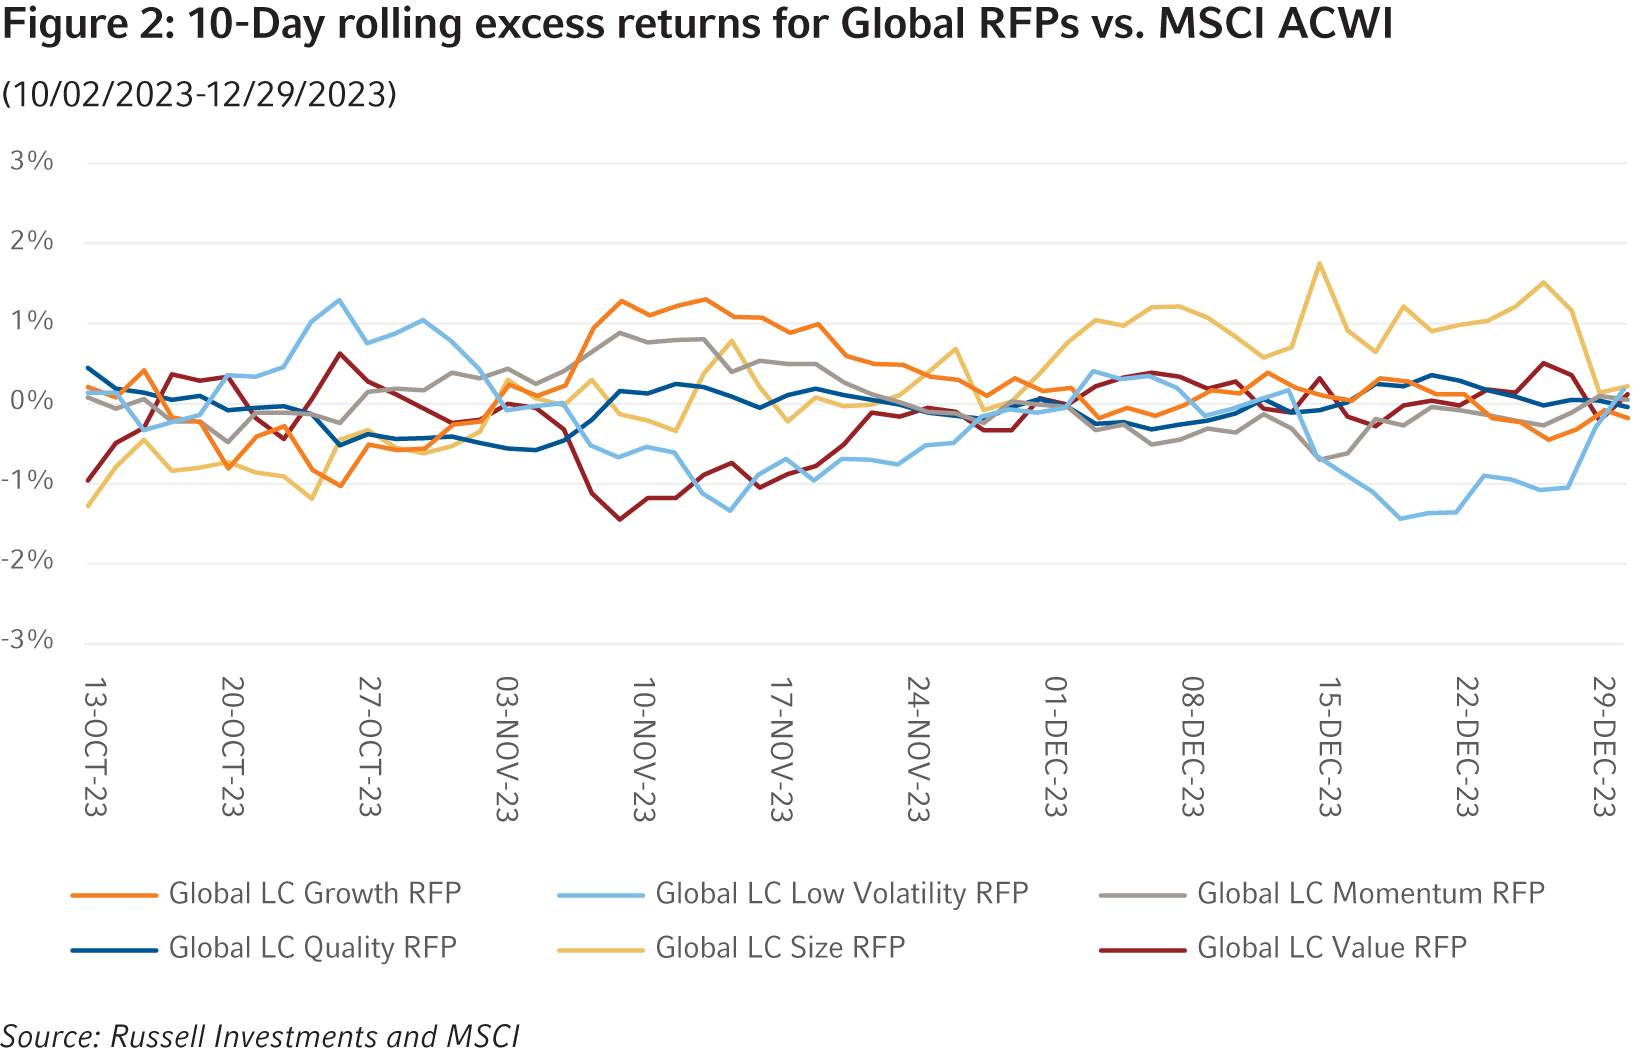
The performance dispersion among Global Russell Factor Portfolios (RFPs) this quarter was quite minimal, with a slight uptick noted in the first half of November and toward the end of December. During November, Value and Growth diverged, with Growth outperforming Value by +2%. The size factor had a strong reversal, underperforming in October and flipping that trend in November and December. It was the opposite for Low Volatility, which outperformed early in the quarter and then gave up those gains as the quarter progressed. Momentum and Quality had the least amount of dispersion through the quarter.
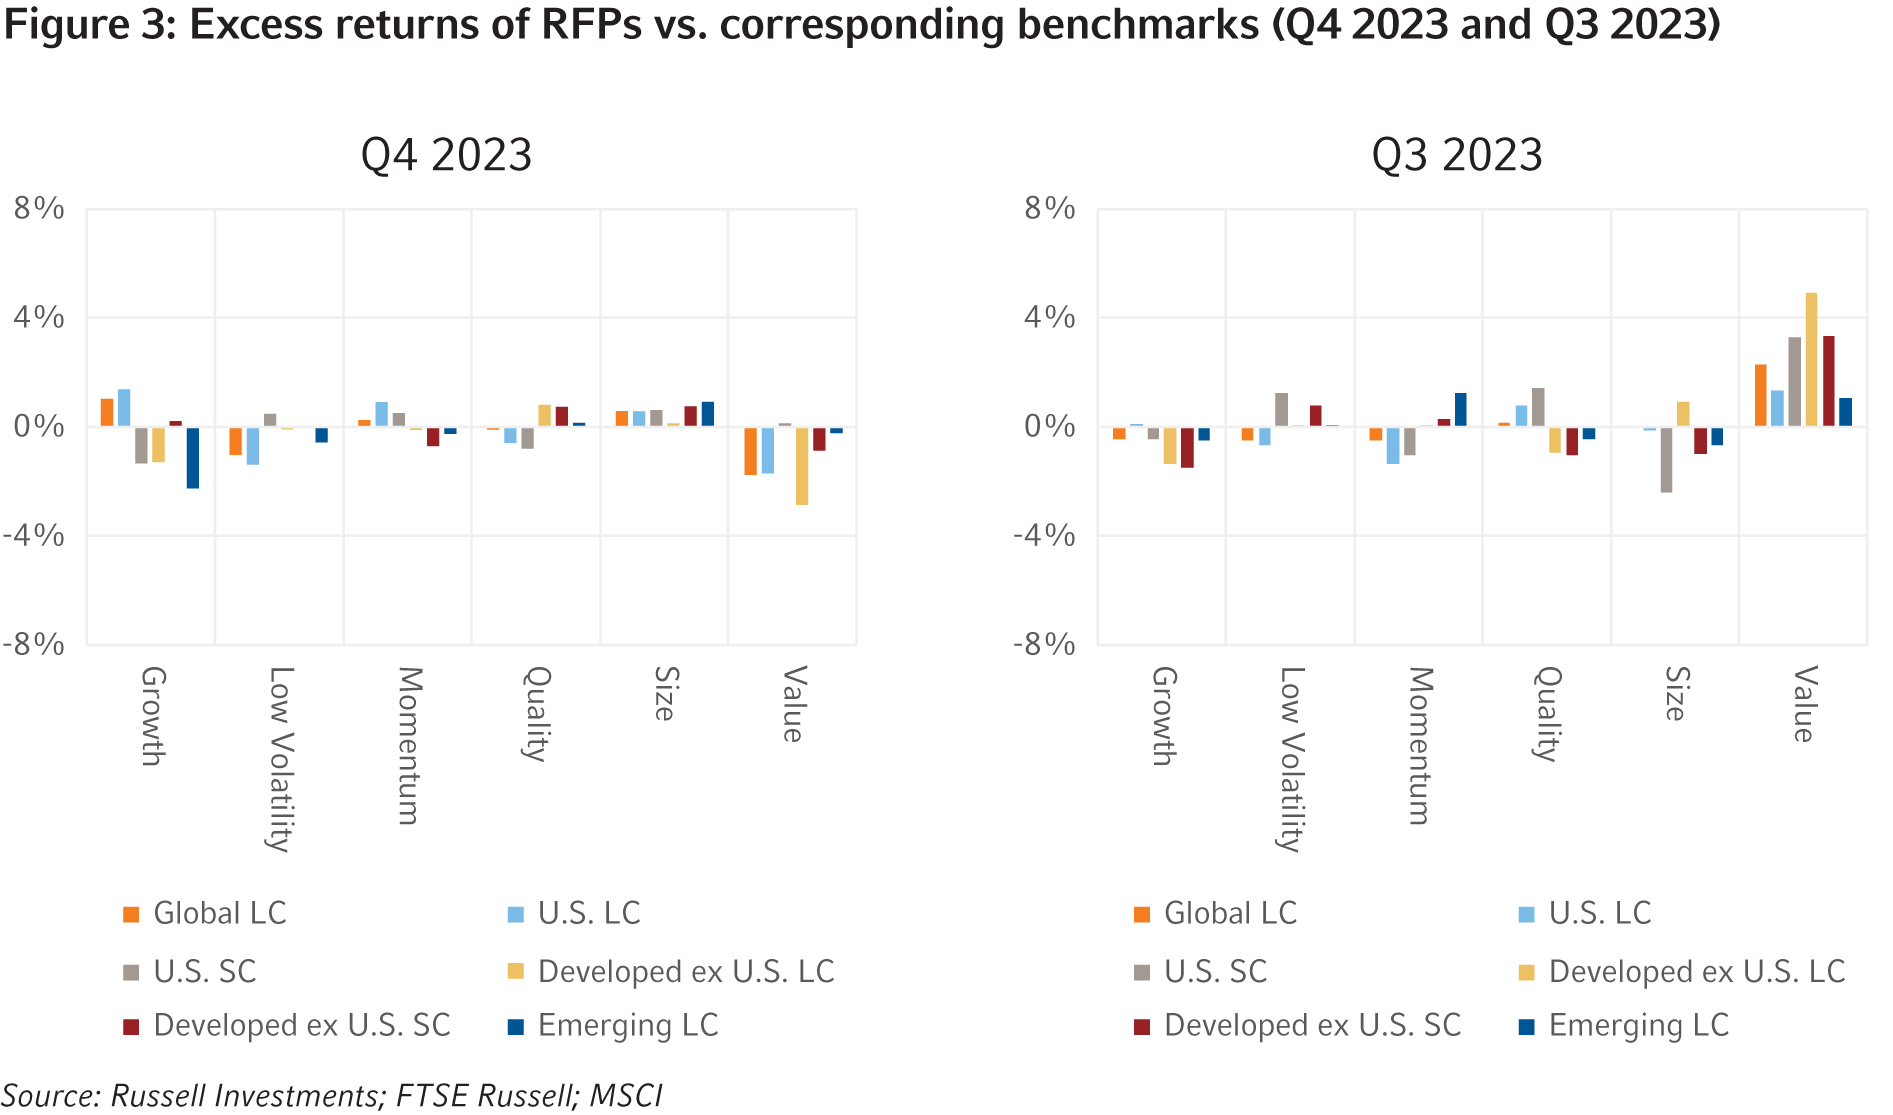
Russell Investments Factor Portfolios’ performance across regions
In the fourth quarter of 2023, the performance of the factor portfolios deviated more by regions than in the prior quarter. The Value factor underperformed across all regions except in U.S. Small Cap, which had a small outperformance of 0.1%. The Size factor had the most consistency of outperformance across all regions. The Global Growth factor outperformance of 1% was largely driven by U.S. Large Cap outperforming by 1.4%, while Developed ex-U.S. and Emerging Markets underperformed (-1.3% and -2.3%, respectively). The performance of Low Volatility, Momentum and Quality was mixed in terms of direction, but Low Volatility had a higher dispersion than Momentum and Quality. The strongest performance among factors was seen in U.S. Large Cap, where Growth and Momentum outperformed by 1.4% and 0.9%, respectively. The weakest performance among factors was in Developed ex-U.S. Large Cap, where the Value factor underperformed by -2.9%.
Performance of subfactors in the global universe
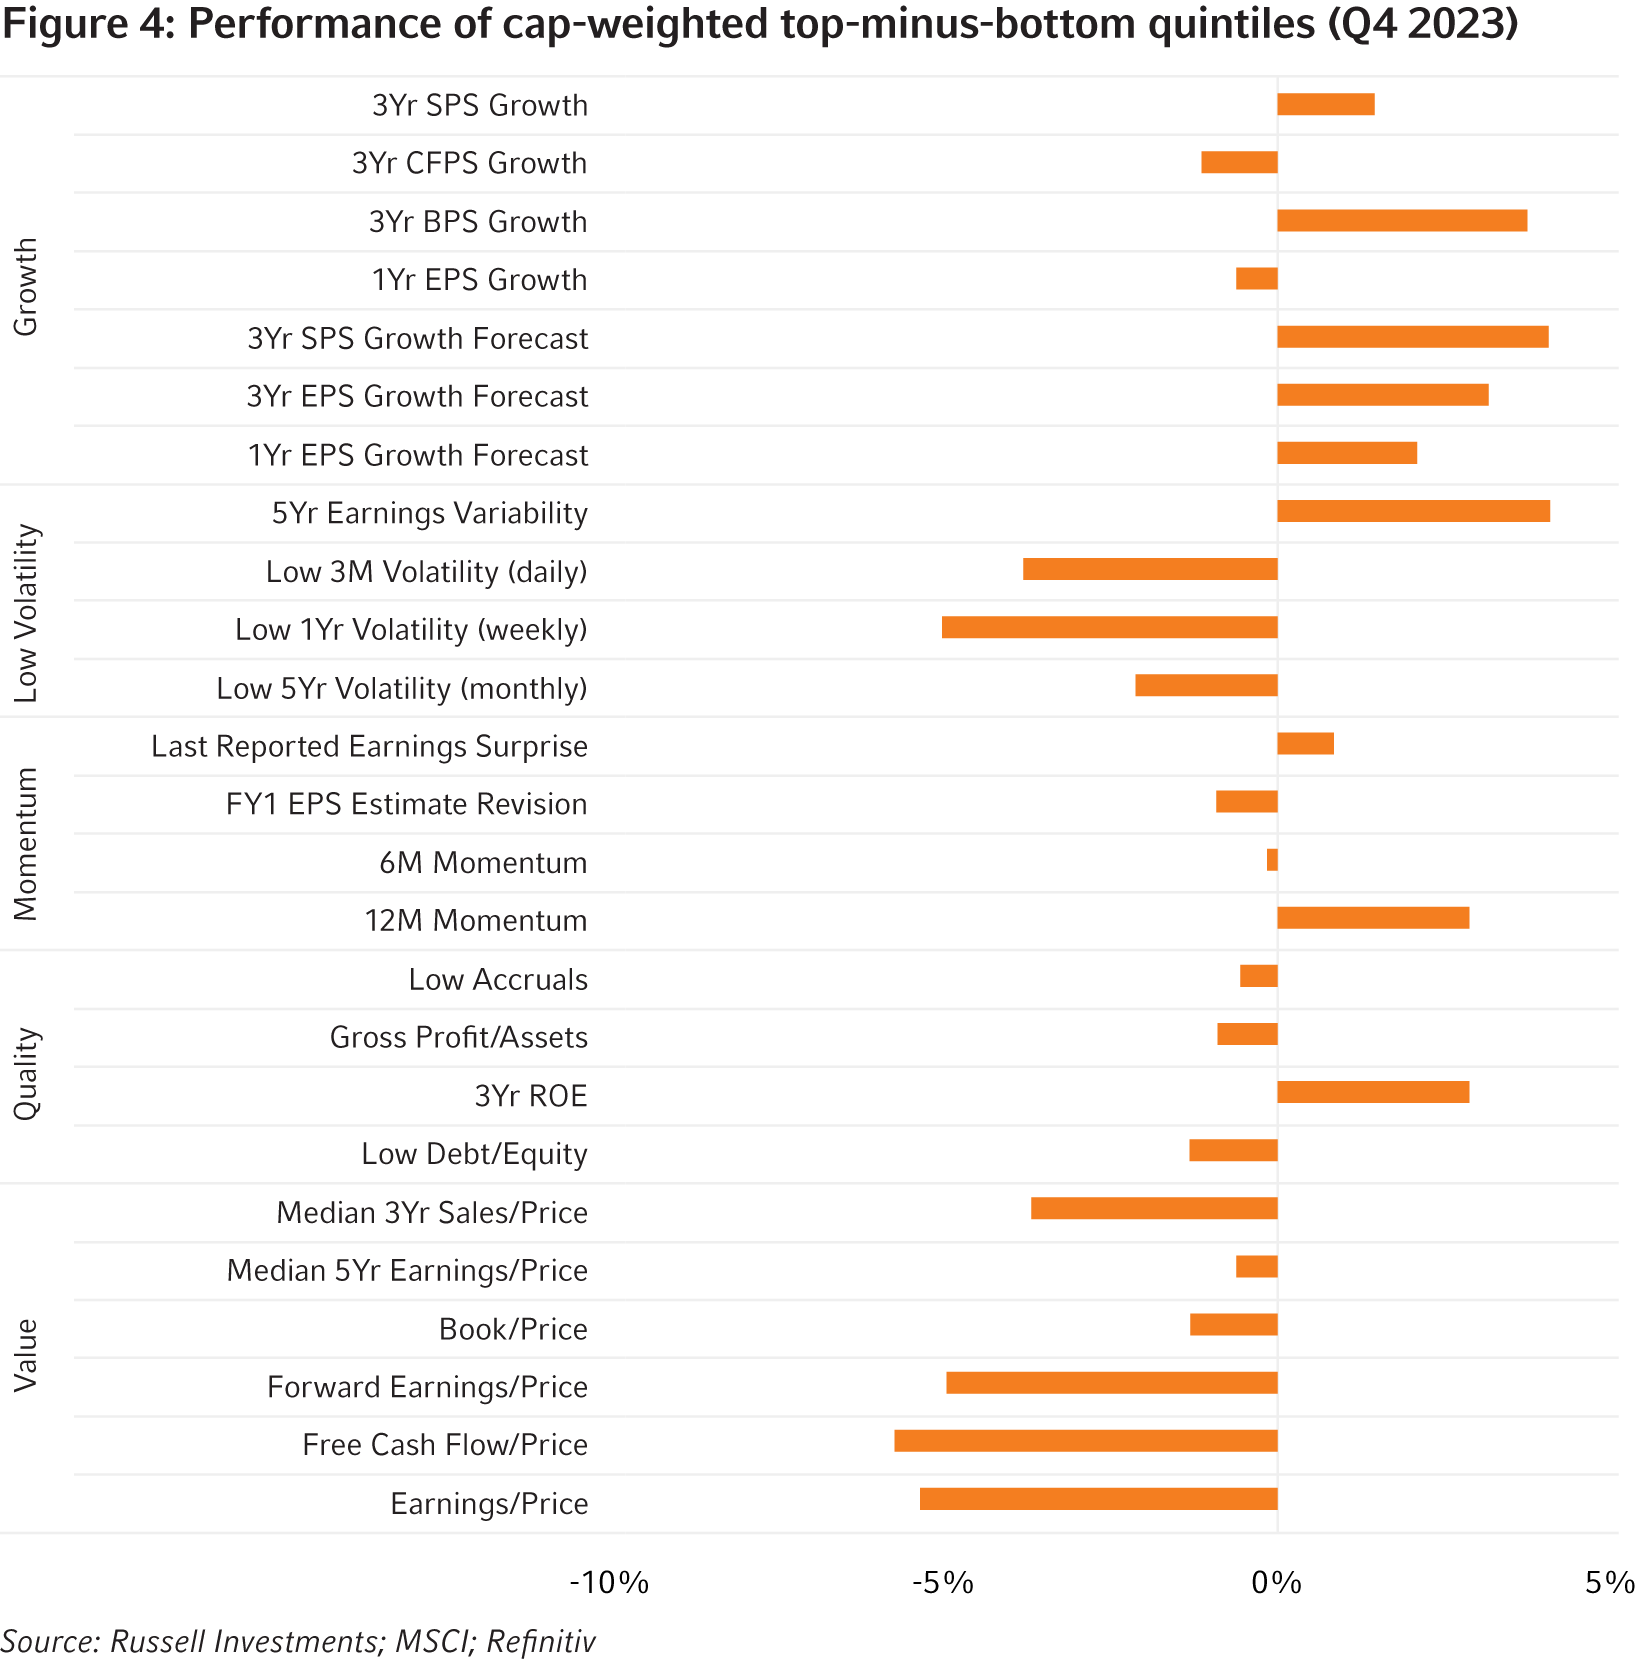
Figure 4 below illustrates the performance of various subfactors in the MSCI ACWI universe for the last quarter, represented by top minus bottom quintile portfolios.1 All Value subfactors underperformed in Q4 while most Low Volatility subfactors underperformed. Earnings Variability was the lone exception, with most of the outperformance coming in October. The performance of the remaining subfactors within factor groups was mixed. 5-year Earnings Variability showed the strongest performance (+4.1%), a reversal from the prior quarter when it was the worst performing factor. Free Cash Flow to Price was the largest laggard at -5.7%.
Ex-ante correlations and active risk of Global Russell Investments Factor Portfolios
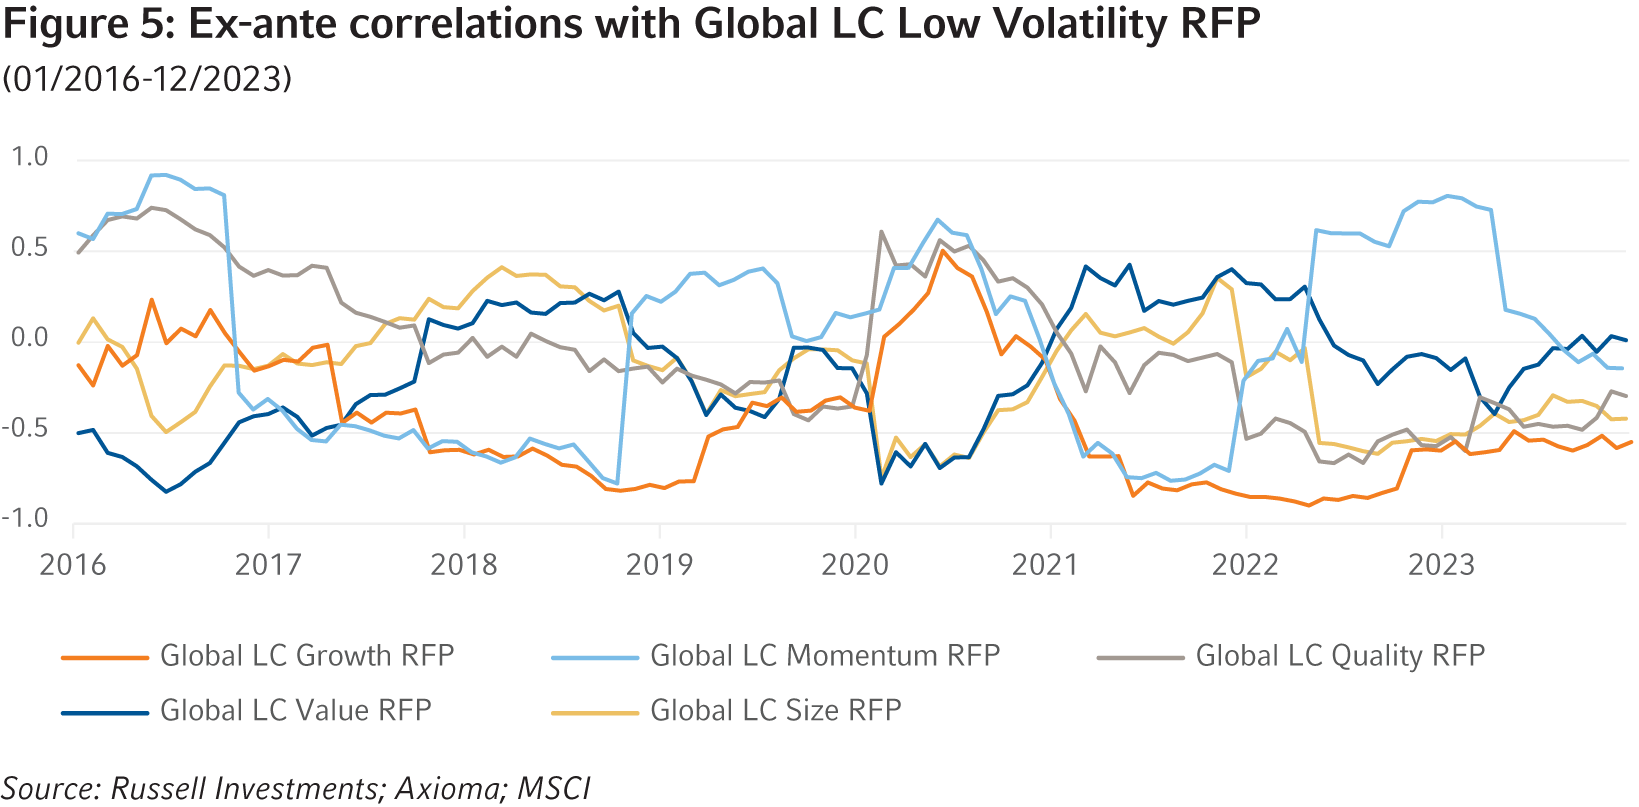
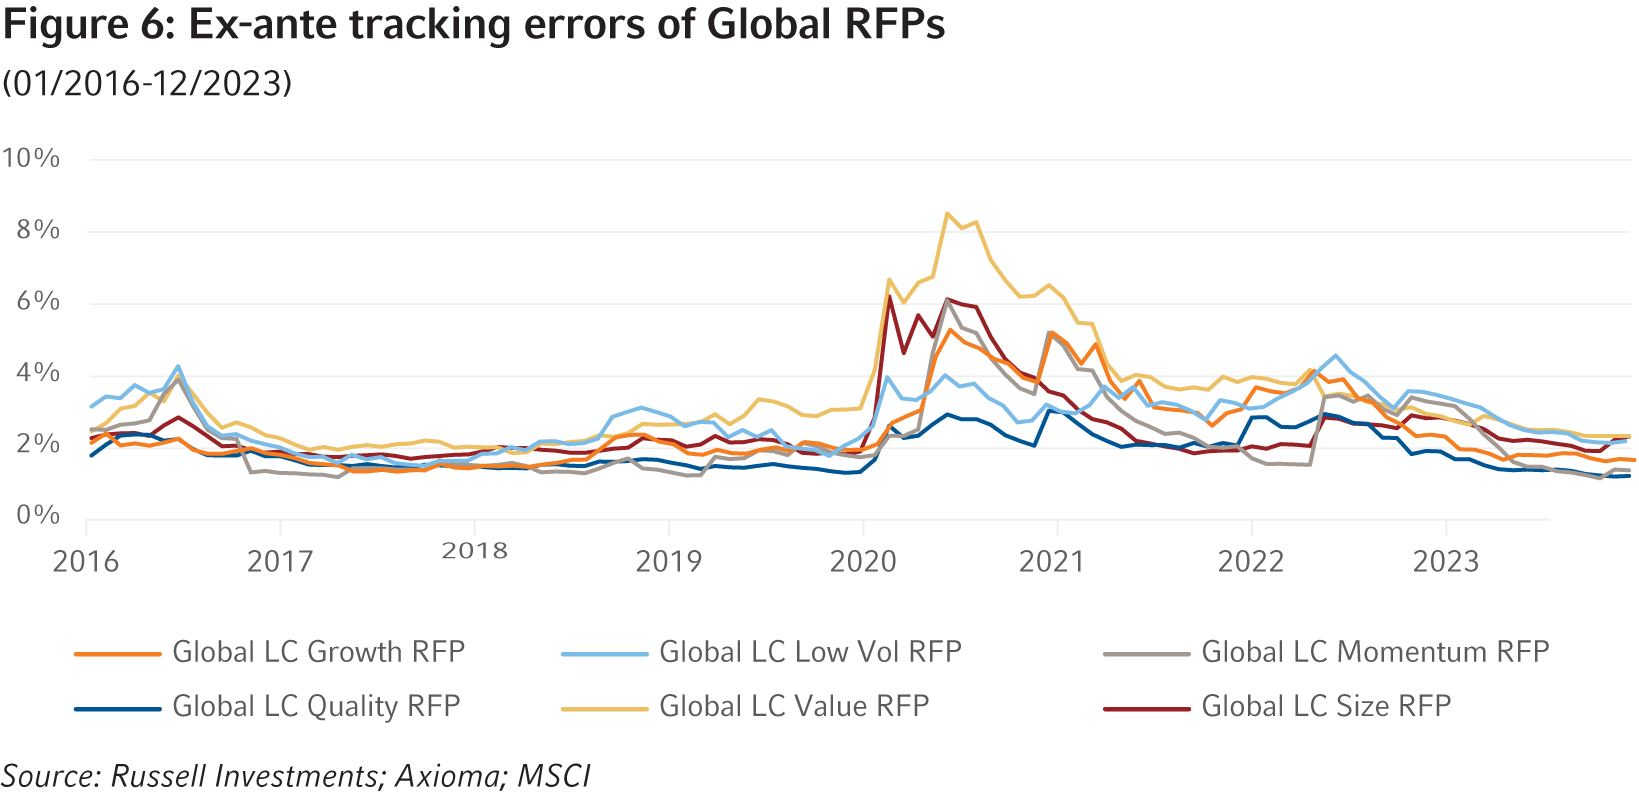
There have been no significant changes in the correlation structure since September 2023, as illustrated in Figure 5 below. While there has been a slight shift in the trend between Size and Low Volatility, it’s overall fairly muted. Momentum continued its trend of moving from positively correlated at the beginning of the year to uncorrelated. The rest of the correlation estimates have largely remained stable, with no significant changes. While we observed an uptick in the ex-ante active risk levels—predictive measures of the active risk associated with factor portfolios in Figure 6—for Size over the prior quarter, the remaining factors have maintained a consistent downward trajectory, continuing a signal from the prior quarter of a return to normal in the active riskiness of these portfolios.
Spotlight on: Factor performance in different interest rate regimes
In November and December, markets rallied on rising optimism of an end to interest rate increases and the possibility of interest rate cuts in 2024. During this rally, we observed a shift in leadership to growth strategies vs. value strategies. If interest rates have indeed peaked—as investors expect—and a period of easing is realized in 2024, what is the impact on factor performance during these different regimes? We examined historical periods of different interest rate regimes and inspected factor performance during and immediately after these regimes. The charts below show the results of our findings.
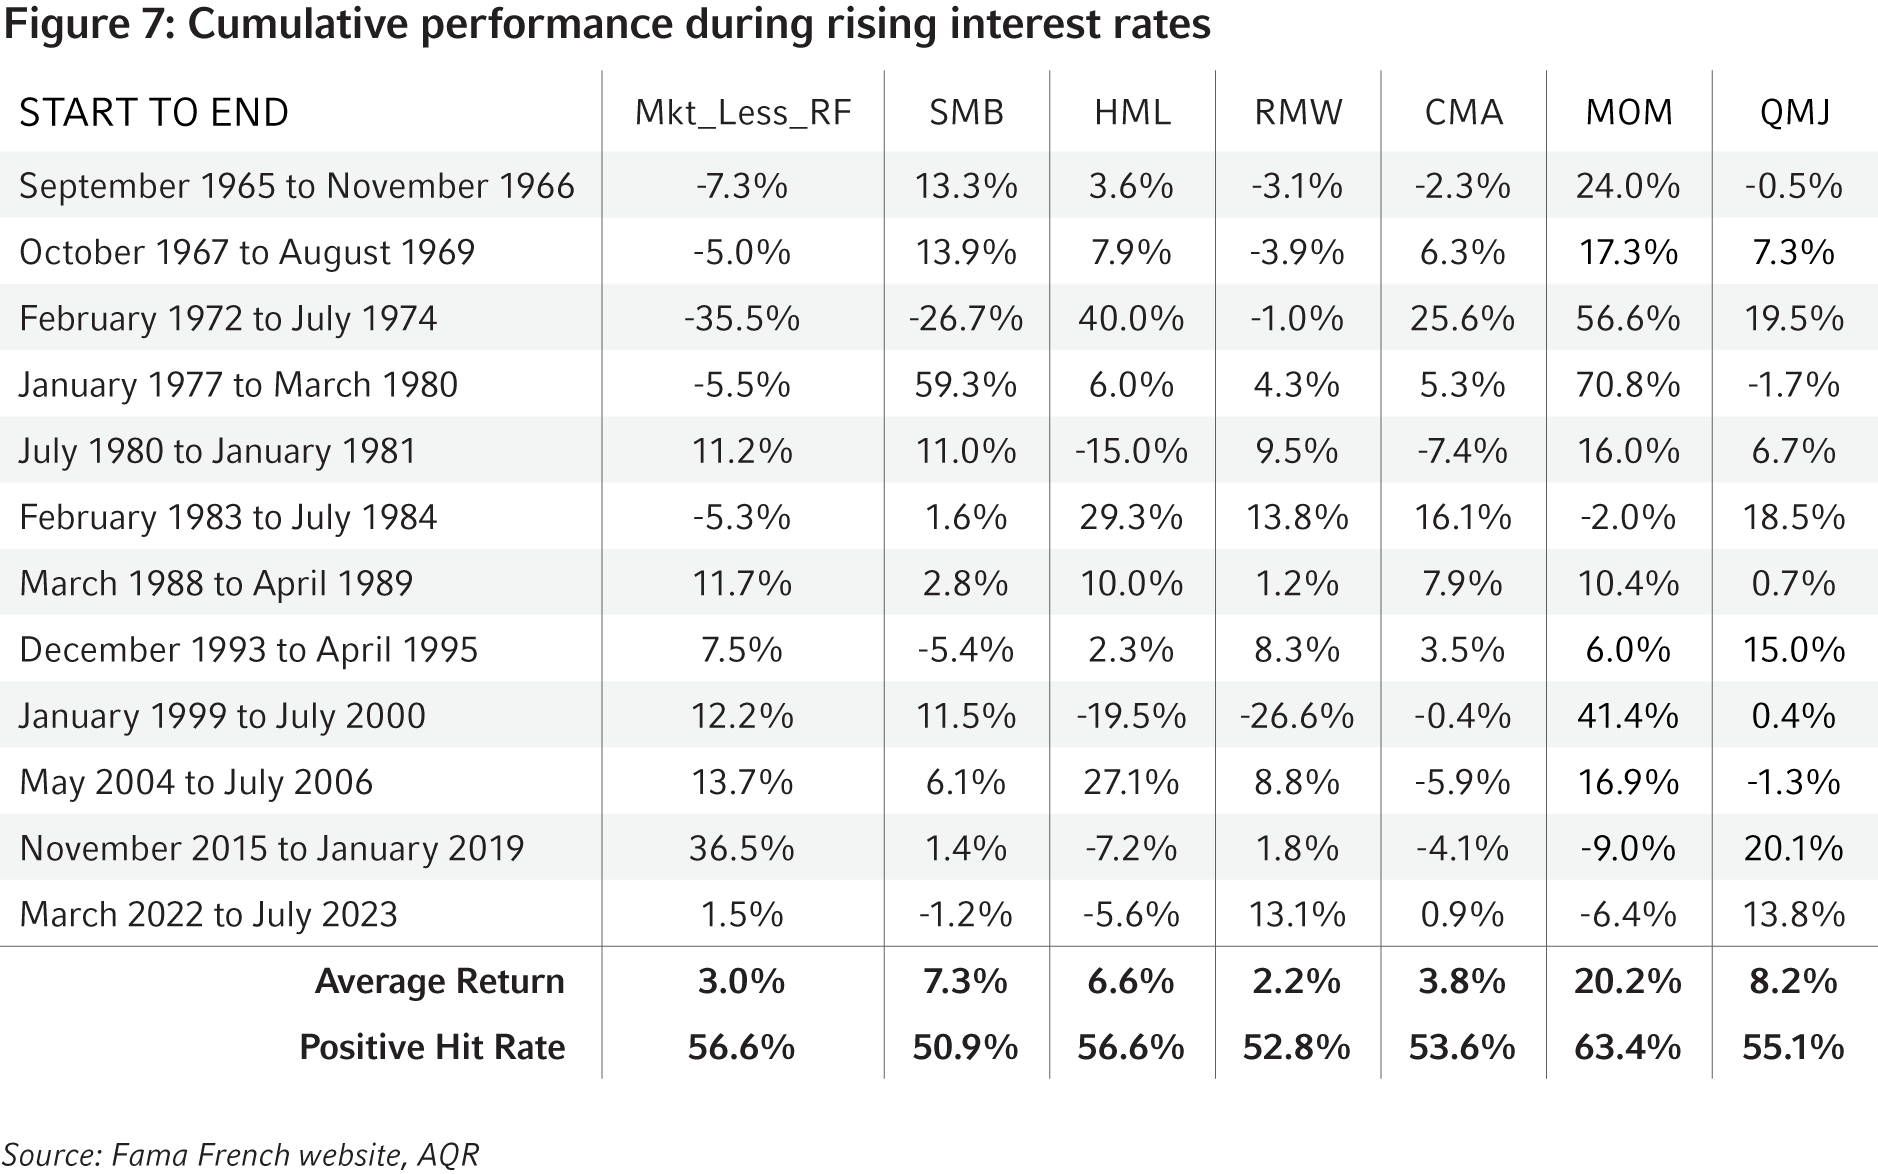
During periods of rising interest rates, Momentum (MOM) was the strongest performer with a +20.2% return and a high 63% hit rate. Quality (QMJ), Size (SMB) and Value (HML) are next with positive performance of +8.2%, +7.3%, +6.6%, respectively. Investment (CMA, Conservative minus Aggressive) and Profitability (RMW) were significantly weaker with respective performance of +3.8% and +2.2%.
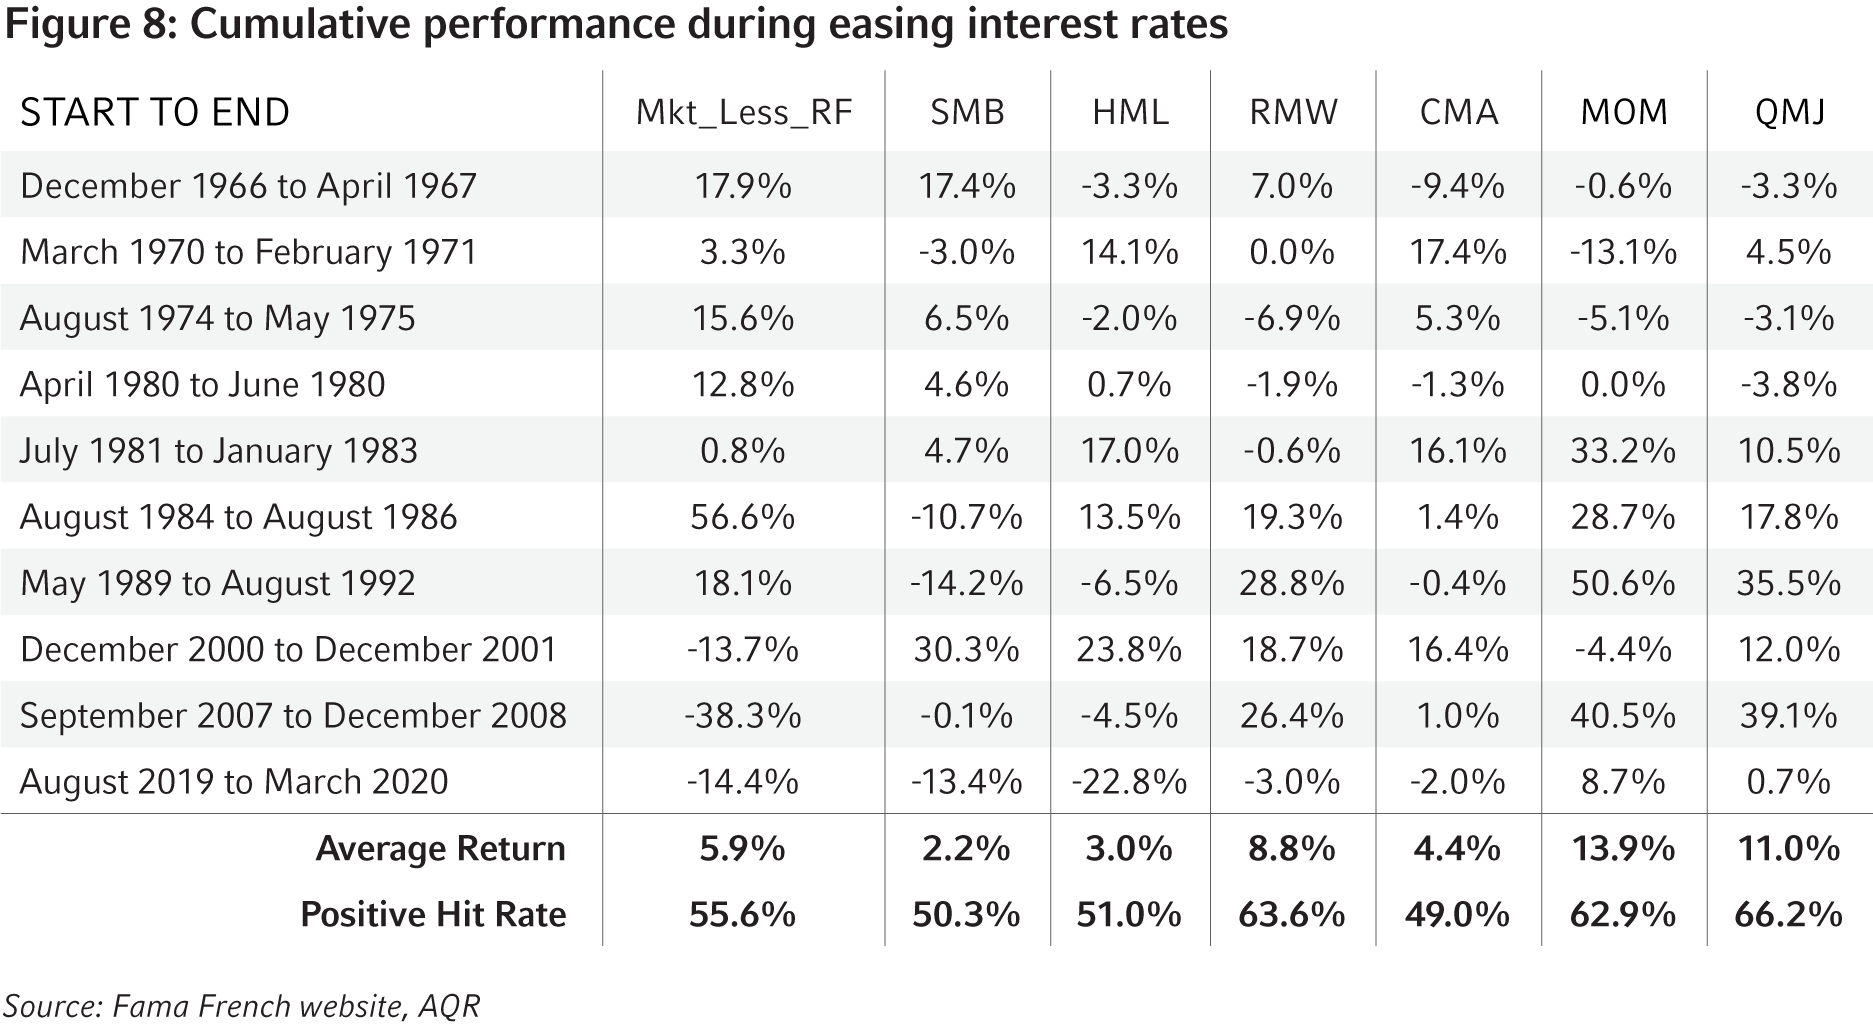
Interestingly, when compared to a rising interest rate environment, we see that the same factors performed the best. When interest rates were going down, Momentum (MOM) and Quality (QMJ) were the highest performers with returns of +13.9% and +11%, respectively. However, we saw a change in the Profitability (RMW) factor with a positive return of +8.8% compared to only +2.2% during rising interest rates. We saw the reverse with Value and Size, with those factors being the weakest performers with the average return down by -3.6% and -5.1%, respectively, compared to periods of rising interest rates. Investment (CMA) didn’t have a large change between the two regimes.
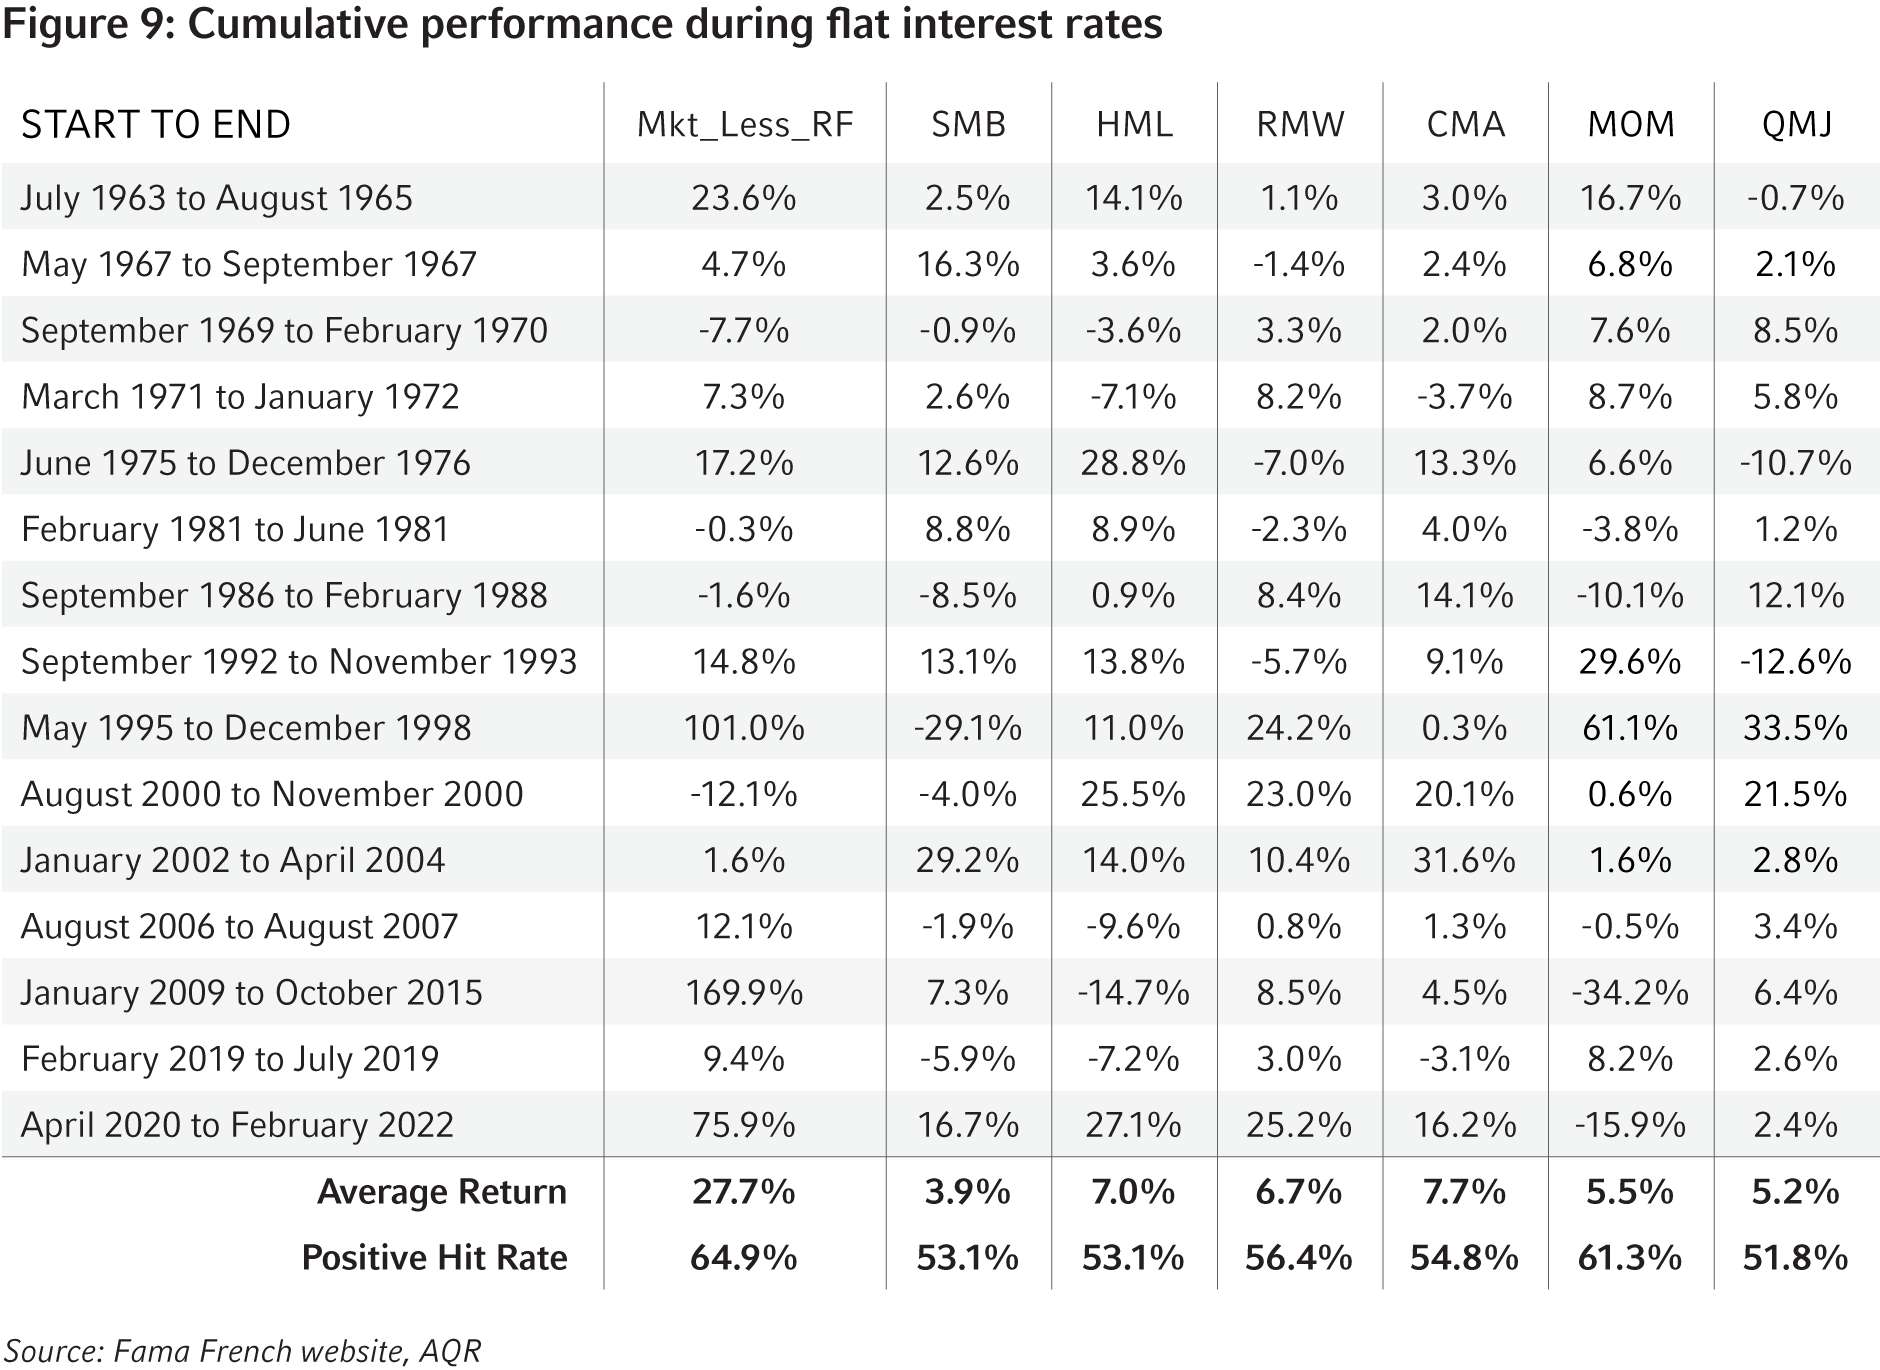
Not surprisingly, the market experienced the strongest performance when monetary policy was in a static state, with a strong +27% return. During those periods, Investment (CMA), Value (HML) and Profitability (RMW) were the best performers. Momentum (MOM) and Quality (QMJ) and Size (SMB) were the weakest.
Momentum (MOM) and Quality (QMJ) were the best performers in both rising and falling interest rate regimes. During periods when interest rates were flat and markets were in a recovery phase, Profitability (RMW), Value (HML) and Investment (CMA) were the best performers. Size only performed well in rising interest rate regimes and was the weakest performing factor in other regimes.
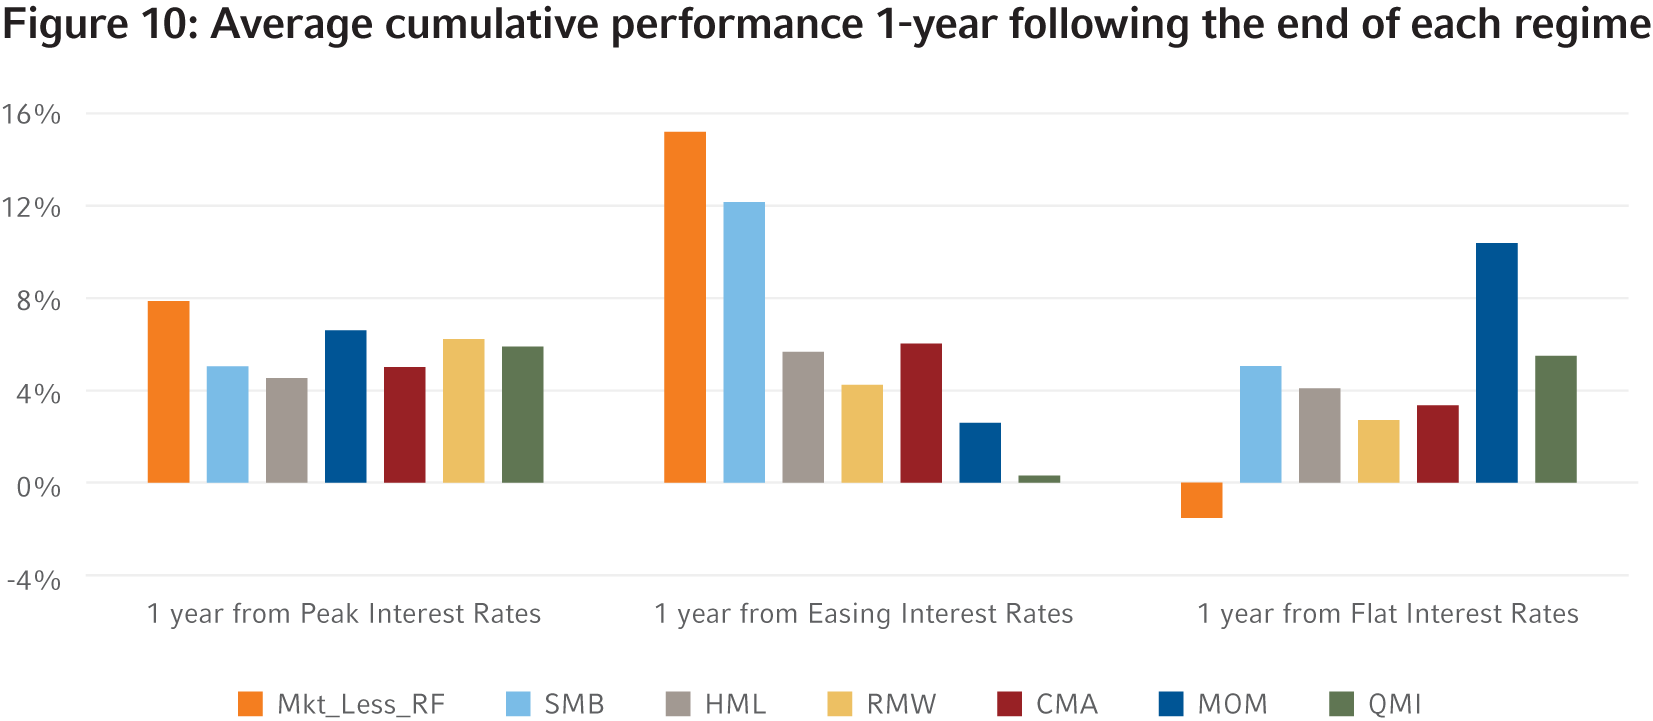
Finally, we looked at the performance of the factors one year after the end of each regime. Here, we observed a low distinction in returns following peak interest rates, with Value (HML) performing the worst (+4.5%) while Profitability (RMW), Momentum (MOM) and Quality (QMJ) were the best performers (+6.5%, +6.2%, +5.8%, respectively). During the market recovery phase, one year following the lowest point in interest rates, Size (SMB) was by far the best performer (+12%), followed by Investment (CMA) and Value (HML) with returns of +6.0% and +5.6%, respectively.
The one-year period following flat interest rates was best characterized by a shift from recovery to an expansion phase of the market. Here, we saw a shift in leadership, with Momentum (MOM) and Quality (QMJ) as the best performers, with returns of +10.3% and +5.4%, respectively. Size (SMB) and Value (HML) were next at +5% and +4%. Investment (CMA) and Profitability (RMW) were the weakest with returns of +3.3% and +2.7%, respectively.
The bottom line
- Russell Investments’ Global Large Cap Growth, Momentum and Size factor portfolios outperformed the MSCI ACWI benchmark, while Global Large Cap Value and Low Volatility underperformed. The Global Large Cap Quality factor portfolio was flat for the quarter.
- The correlation between Global LC Momentum RFP and Global LC Low Volatility RFP continued to decrease, while the rest of the correlation estimates remained stable from the prior quarter.
- During periods of falling interest rates, the Momentum (MOM) and Quality (QMJ) factors have historically performed the best.
1 Top minus bottom cap-weighted quintile portfolios are not investible and are used to proxy the performance of the subfactors used in the construction of RFPs. RFPs are long only portfolios.