An oldie but a goodie: The global balanced portfolio
In hosting a recent virtual study group with a few select advisors, one advisor kept having to leave the discussion because she had so many Amazon packages being delivered. Another kept having to excuse himself because the show his kids were watching on Netflix was playing too loudly in the background. This sparked a discussion among all of us about the influence that these tech companies have—both in our current lives and in markets. We all agreed that it’s remarkable how a handful of large companies can consume our attention spans and wallets to such a degree.
This conversation isn’t new; it usually comes up after periods of market volatility. When the S&P 500 continuously goes up, advisors tell me their clients are happy investing into the U.S. market through a passive index fund. The same is true when it comes to Canada's benchmark S&P/TSX Composite Index. But when markets go down, some clients start asking for defensive, actively managed strategies that look for globally diversified opportunities to potentially lower risk.
I believe our industry has created its own challenge by focusing on benchmark–relative returns rather than helping clients reach their desired outcomes. This focus could lead to unintended risk in a portfolio, especially as key companies become increasingly larger components of benchmark indexes.
Concentrated line–up
Let’s look at the risk present in chasing either the S&P 500 or the S&P/TSX Composite Index because of the concentration of a few large companies.
Click image to enlarge
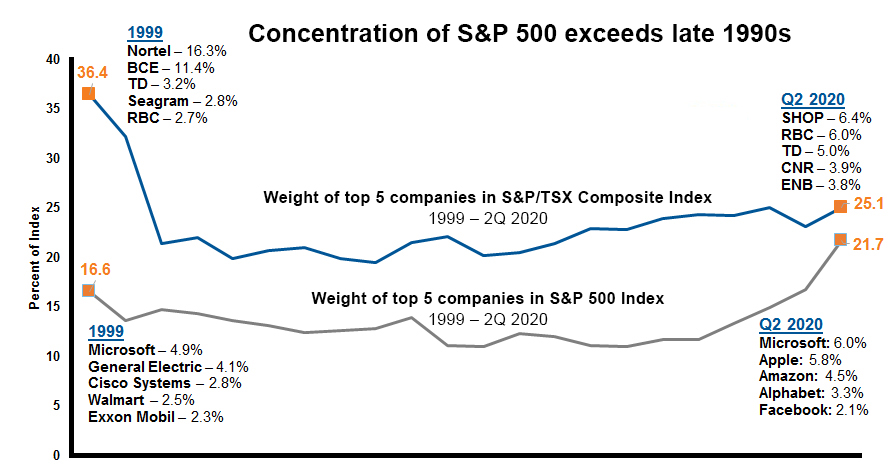
Source: Factset. As of June 30, 2020.
Weights based on year end values
Alphabet represents both A&C share classes
As illustrated in the chart above, concentration of larger companies is a significant issue in Canada and has become an issue in the U.S.
The top five capital–weighted stocks in the S&P/TSX Composite represent more than one–quarter of the total market capitalization and include two banks. Still, that is less than in 1999, when telecommunications giants Nortel and BCE dominated the index.
In the U.S., the top five capital–weighted stocks in the S&P 500 now represent slightly more than 20% of the market cap. The last time the top five stocks had this type of capital weighting was in 1999 at about 17%—before the tech bubble burst. Microsoft is the only stock still represented in this statistic 20 years later.
Not surprisingly, the question many U.S. investors face today has become: Are you paying too much for the remaining 495 stocks you own? If a small concentration of stocks represents 20% of the index 20 years later, do you carry the risk of owning more losers along with the winners over the long haul?
As the market capitalization weighting increases in the S&P 500, the narrow leadership of growth drives most market returns. The potential risk in a client’s portfolio is the market volatility resulting from the top five stocks representing 20% of the market selling off. That’s adding insult to injury.
While a growing concern in the U.S., this is a well–known issue in Canada, which is dominated by the financial services and energy sectors.
Getting too familiar: Buying what you know
Humans prefer what is familiar or well-known. Since working from home, many of us may be using more Amazon and Apple products. The same holds true for investing: many investors prefer stocks based in their own country. This home-country bias may well show up in our investment portfolios.
Moreover, home-country bias limits the amount of diversification in investor portfolios and exposes investors to significant country-specific risk. Investors who diversify their portfolios tend to represent global market capitalization better.
Click image to enlarge

Source: Market capitalization of domestic listed companies (2017, in current USD)---World Bank https://data.worldbank.org/indicator/CM.MKT.LCAP.CD?view=map Accessed on May 15, 2019. Home country equity allocation—John R. Nofsinger, The Psychology of Investing, Fifth Edition, Pearson, 2014, p. 89.
The case for the balanced portfolio
A balanced portfolio – typically represented by 60% stocks and 40% bonds – over time can help smooth out the investment experience. As you can see from the chart below, a balanced 60/40 global stock/bond portfolio has provided positive returns for investors over the long term.
Click image to enlarge
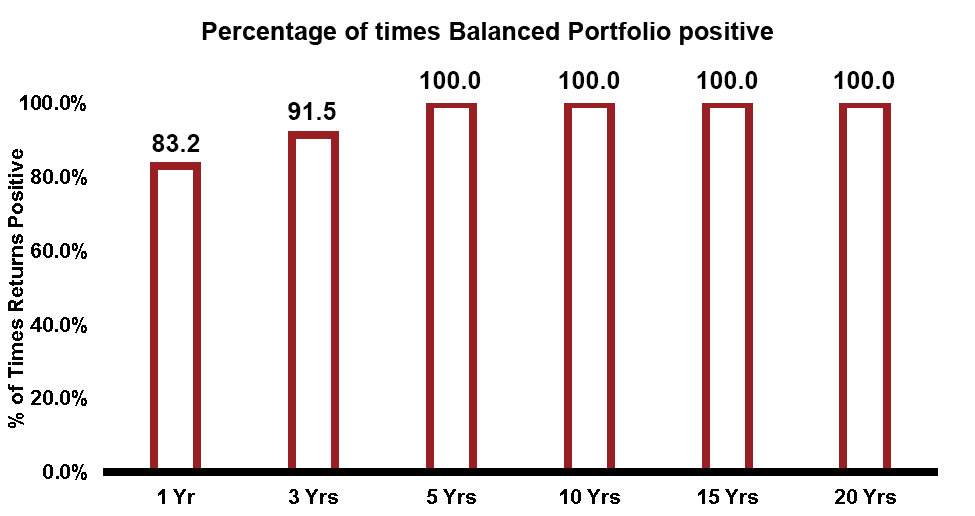
Source: eVestment Alliance, Russell Investments. Balanced portfolio contains: 20% S&P/TSX Composite Index, 20% S&P 500 Index, 20% MSCI EAFE Index and 40% FTSE Canada Universe Bond Index. In CAD. Based on respective rolling period. Rolling periods refer to continuous return streams of the specified time periods. or example, the 1-year bar represents all one-year period returns over the January 1970-December 2019 period. (August 31, 2018 to August 31, 2019/ July 31, 2017 to July 31, 2018 etc.) Similar calculations were used for each time period shown. Indexes are unmanaged and cannot be invested in directly. Past performance is not indicative of future results.
Diversification may mute the downside
When Canadian equities (as measured by the S&P/TSX Composite Index) fell 22.3% from February 1 to March 31, 2020, it was the drop that made the headlines. During the same period, a hypothetical balanced portfolio fell 10.8%. We all desire market-like returns when things are going up, but not on the way down. A more diversified portfolio may help reduce the downside risk — and resulting pain — during historic drawdown periods.
Click image to enlarge
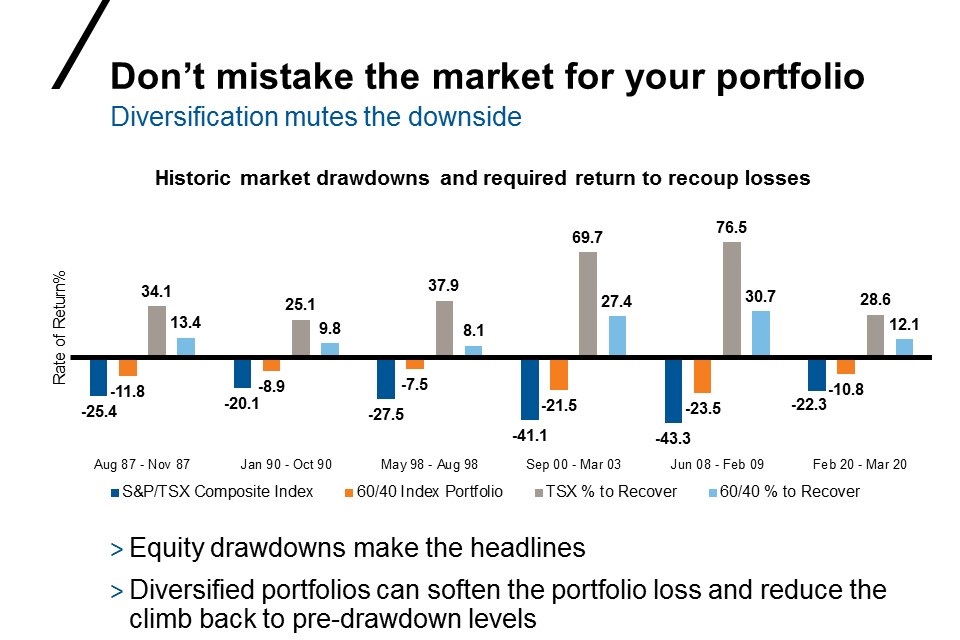
Source: Russell Investments.
60/40 Index Portfolio: 20% S&P/TSX Composite Index, 20% S&P 500 Index, 20% MSCI EAFE Index and 40% FTSE Canada Universe Bond Index. Index returns represent past performance, are not a guarantee of future performance, and are not indicative of any specific investment. Indexes are unmanaged and cannot be invested in directly. % to recover shows the gains needed to recover from the loss.
The bottom line
As financial markets remain unpredictable, a trusted financial professional can help:
- Provide education on potential biases that may be affecting investment decisions
- Create a process that considers an investor’s goals, circumstances and preferences to keep them focused on long–term outcomes
During these uncertain times, helping clients appreciate an oldie but a goodie—the balanced portfolio—while also objectively recognizing biases that could lead to poor investment decisions, are tasks paramount to an advisor’s role. And that’s why we believe advisors have arguably never been more vital than today.
1Yahoo Finance as of 28 May 2020
2Yahoo Finance as of 28 May 2020