Are recession risks increasing in the U.S.?
 Source: Thomson Reuters Datastream, National Bureau of Economic Research
How economists look at recessions
Recession forecasting is hard—done correctly it is an exercise of evolving probabilities and risks, not bold proclamations of impending doom. In some ways the science of recession forecasting is similar to how geologists model the threat of an earthquake.
Geologists look for areas of tension and imbalance in the Earth's crust (i.e., fault lines). Economists look for evidence of macroeconomic imbalances. These imbalances come in a few different flavours— overinvestment (e.g. late 1990s), overborrowing (e.g. 2007), or an overheating labour market (e.g. late 1960s). We track imbalances as a medium-term risk indicator. They don't tell us precisely when the next recession will hit—but they are very important in determining the danger zones to focus our attention on and when conditions are ripe for a downturn to occur.2
Geologists also use seismographs to measure shaking in the ground. Economists track the economy's performance in real-time, looking for leading indicators that suggest a slowdown may be imminent or already underway.
The intersection of macro and markets
Recessions are damaging events for asset prices. They simultaneously act as a catalyst for valuation multiples to correct (as investors become more risk averse) and as a catalyst for corporate earnings to falter (as top-line growth slows). As such, recessions have been the driver of most of the bear markets3 in modern U.S. history.
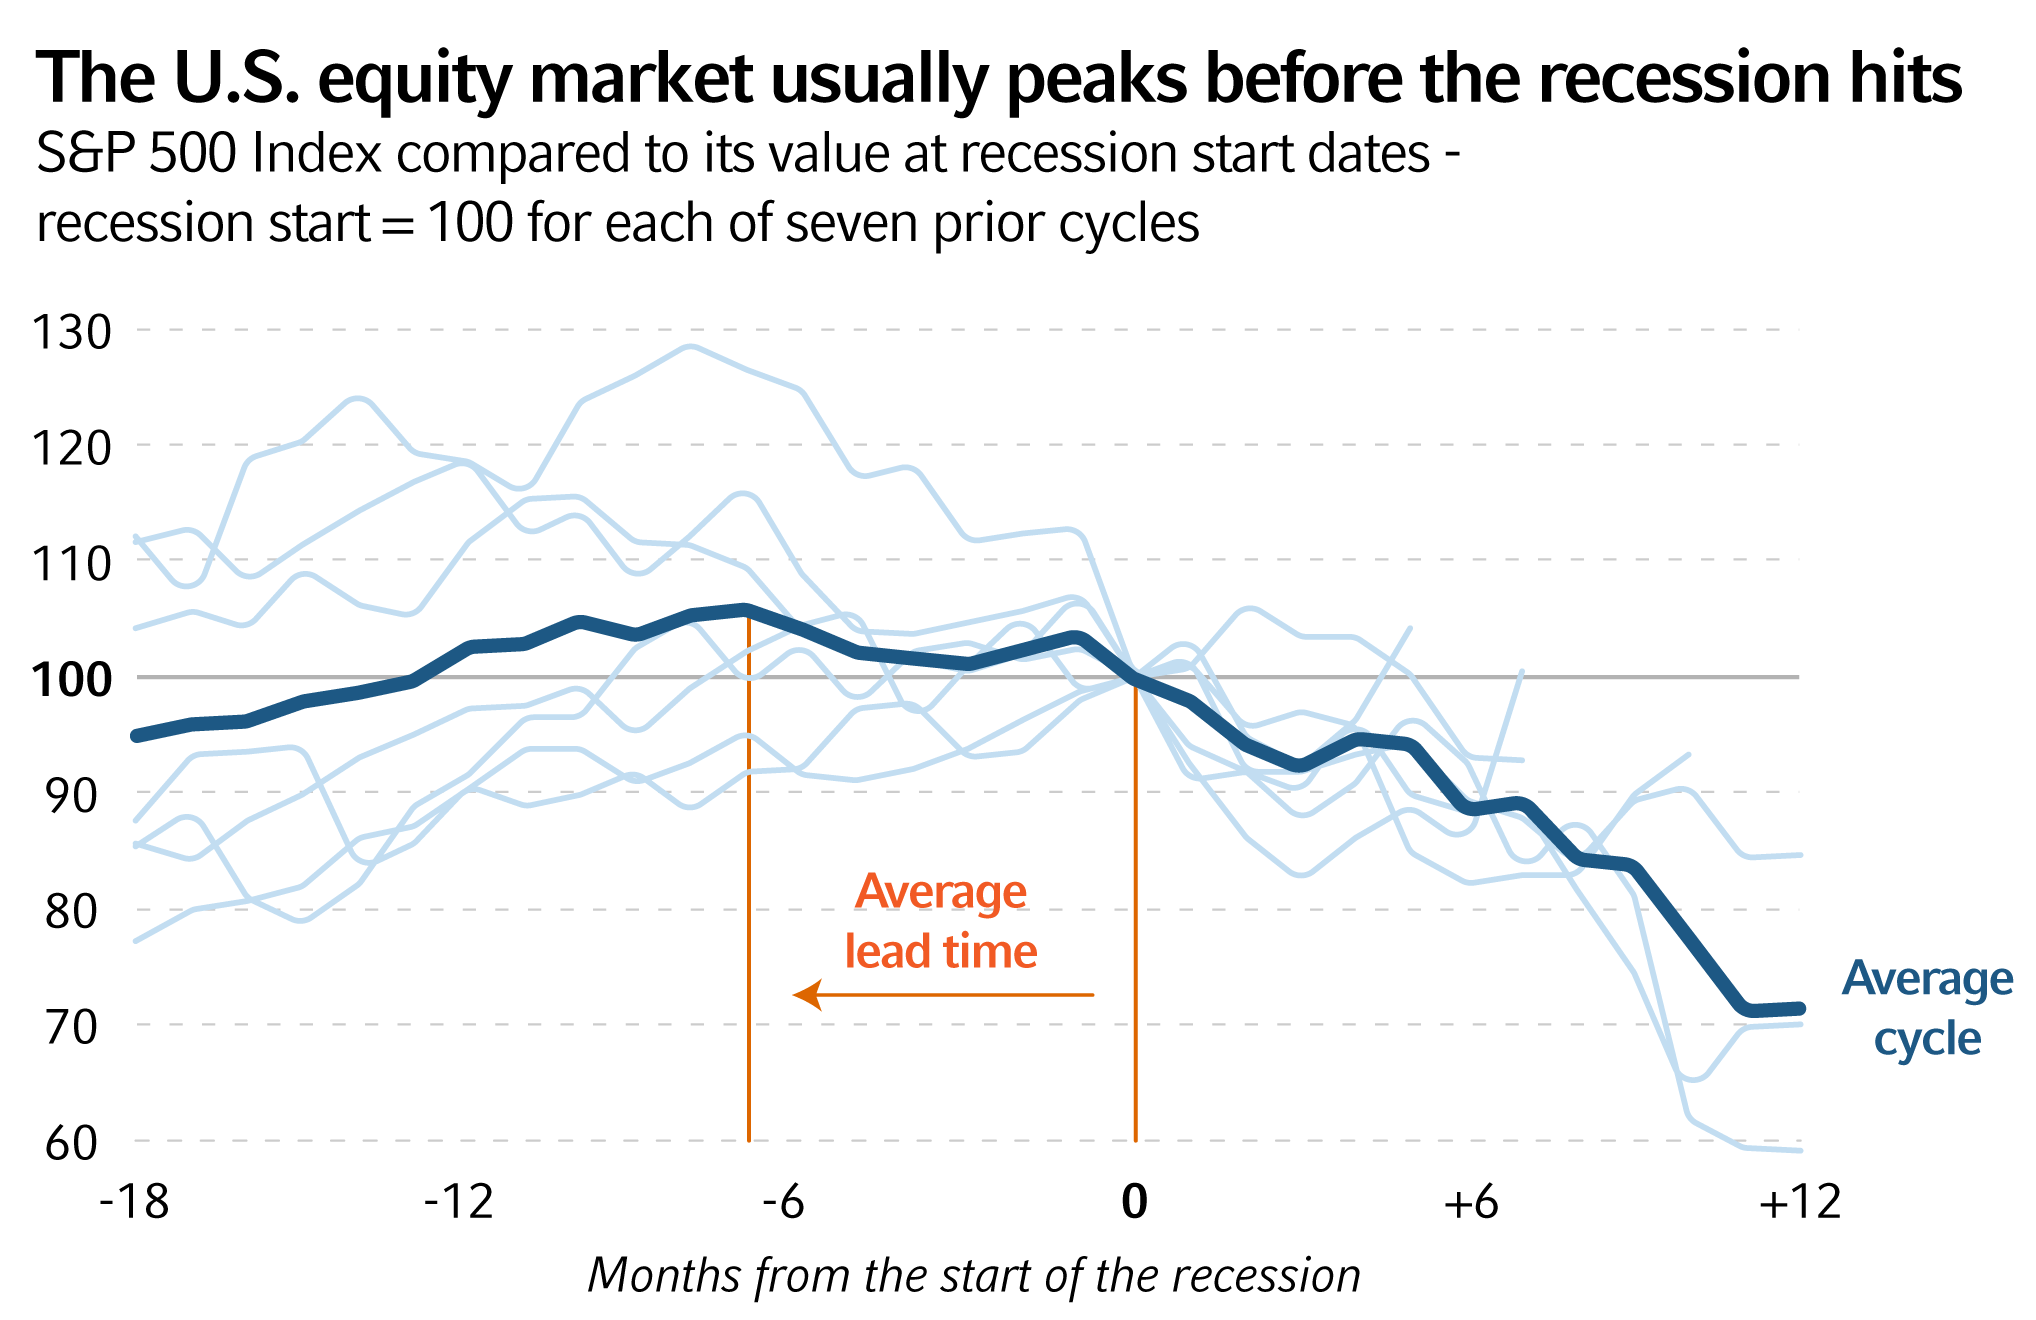
But it's not good enough to simply know if we're in a recession right now (hint: we're not). Financial markets anticipate future movements in the real economy. Our analysis of business cycles in the post-World War II period shows that, on average, U.S. equities peaked roughly six months before the onset of the recession. In our view, this means that real-time monitoring efforts need to focus on leading indicators that give investors enough runway to get ahead of moves in asset prices.
 Source: Thomson Reuters Datastream, National Bureau of Economic Research, Russell Investments
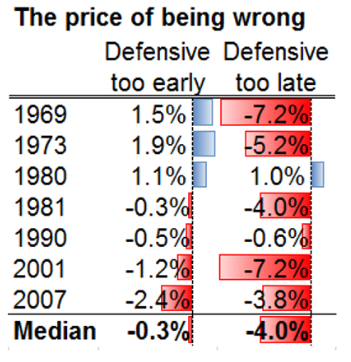
We also believe that investors need to be cognisant of the fact that there is a price to being wrong on a recession call. Investors can be punished for adopting a defensive strategy too early—markets often have a blow-off rally phase at the end of the cycle as markets break into euphoria. Investors can also be punished for leaving the party too late. The table below is one of the ways we've attempted to estimate what we refer to as the price of being wrong. Generally speaking, it costs more to stay at the party too late than it does to leave too early. But, from our vantage point, both mistakes need to be carefully weighed in formulating an investment strategy.
Source: Thomson Reuters Datastream, National Bureau of Economic Research, Russell Investments.
Defensive too early: Excess returns of a portfolio that moves away from a strategic 60/40 position to a 40/60 position 18 months before a recession, and holds that position for a year.
Defensive too late: Excess returns of a portfolio that stays overweight risk (80/20) 12 months beyond the average peak of the U.S. equity market prior to a recession.
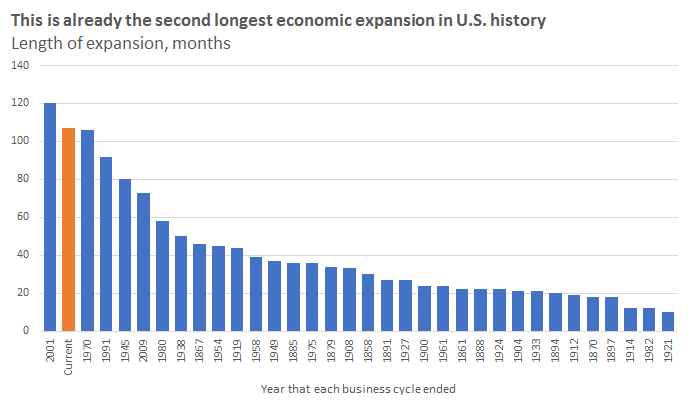
So, where are we now?
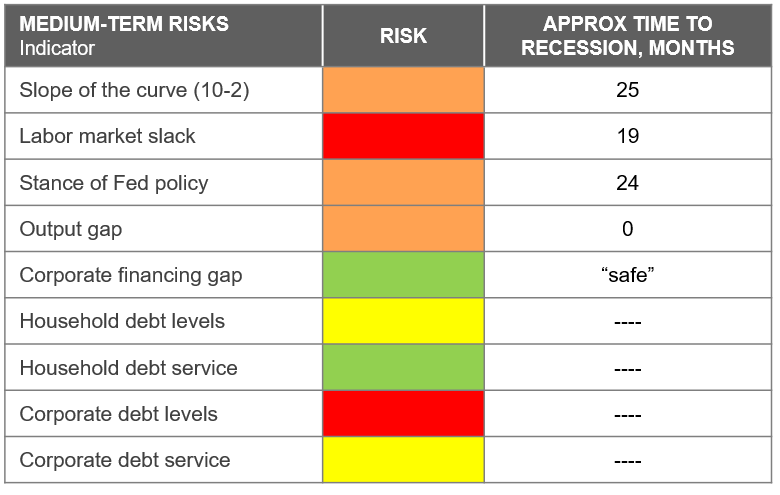
After nine years of uninterrupted economic growth, we're getting late in the U.S. economic cycle. Some measures of macroeconomic imbalance are starting to flash amber or red. Corporate debt levels are worrisome, the labour market looks to be on the cusp of overheating and the U.S. Federal Reserve (the Fed) is talking about moving to a restrictive policy stance “at some point”. That suggests to us that medium-term recession risks are elevated. But, to be clear, the ground isn't shaking right now. High frequency activity indicators continue to suggest moderate, positive economic growth in the near-term. The table below shows a mosaic of the several indicators we track each month and the signal from them right now.
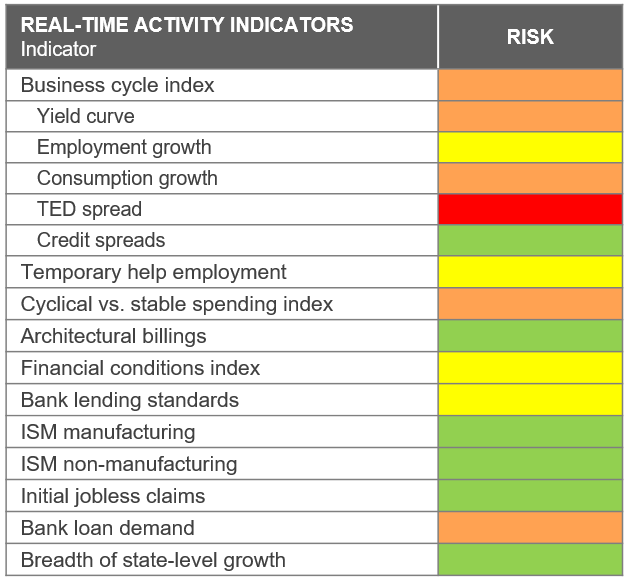
Source: Russell Investments subjective assessment of late cycle risks in the United States as of May 2018. Source for underlying historical data used to assess each indicator from Thomson Reuters Datastream.
Based on the above, our best forecast on the timing of the next U.S. recession is late 2019 or 2020. To amplify this point, let's focus on the message we're getting from the slope of the U.S. Treasury yield curve right now (the first indicator in the table). Historically, an inverted yield curve—the difference between 10-year and 2-year bond yields—has been one of the single-best leading indicators of an impending downturn.
Conceptually, the slope of the curve is a rough approximation of the stance of U.S. monetary policy. The Federal Reserve controls the level of short-term interest rates. Markets determine the level of long-term interest rates based on underlying macro fundamentals. When the curve inverts, the bond market is sending a warning sign that the Fed has set short-term rates above what is justified by fundamentals (i.e., it has moved to a restrictive policy stance). The curve has been flattening recently and the current spread between the 10-year and 2-year Treasury note is only about 50 basis points.
Because the curve hasn't reached the inversion stage yet, we score this indicator as an amber risk. But, based on our macro forecasts and the recent flattening trend, it's entirely possible that this spread could invert in late 2018 or early 2019. And given that curve inversion has historically predated recessions by nine to 18 months, we see late-cycle risks as becoming elevated around the latter half of 2019.
 Source: Thomson Reuters Datastream, 4/27/2018
Investment strategy implications
We'd reiterate that recession forecasting is subject to considerable uncertainty. But our current estimates suggest that it may still be too early to conclude that the U.S. equity market has peaked. That isn't to say we're constructive on the outlook—quite the opposite, actually. We see expensive U.S. equity market valuations as a significant headwind for the return outlook—limiting the upside potential for markets and exacerbating the drawdown when things invariably do go wrong. This asymmetry argues for prudent risk management as we get into the later innings of the economic cycle. We currently see attractive relative valuation opportunities and stronger cyclical fundamentals in non-U.S. markets. We'd also note that the more defensive areas of the market—such as U.S. Treasuries and low volatility stocks—are trading at some of their best valuations in years after the sustained period of strong and synchronised global growth that started in the middle of 2016.
In short, we're not ringing the alarm bell on the next recession yet. But we're diligently monitoring these risks before any shaking begins.
2 Similarly, a lack of major imbalances can give us confidence to stay invested during an early- or mid-cycle slowdown
such as the U.S. experience with the European debt crisis of 2011-2012.
3 A bear market is commonly defined as a peak-to-trough selloff of 20% or more. Notable exceptions include the crash of 1987, 1966, and the selloff around the Bay of Pigs Invasion.
4 “Defensive too early” tracks the performance of a strategy that takes 20% out of equities and puts it into cash 18 months before the onset of the recession. The performance of that tactical tilt is computed over the subsequent year. Conversely, “Defensive too late” tracks the performance of a strategy that remains 20% overweight equities from 6 months before the onset of the recession until 6 months after the onset of the recession. Recession onset dates are from the National Bureau of Economic Research. Equity market performance is proxied by the total return on the S&P 500 Index. Cash performance is proxied by the return on the 3-month Treasury Bill. Market data is from Thomson Reuters Datastream as of May 2018.