Bah humbug: U.S. markets tumble to yearly lows after Fed guidance projects more rate hikes for 2019
Markets hit the rewind button this afternoon as the U.S. Federal Reserve (the Fed) talked about the need for some further rate hikes in 2019.
While the Fed raised interest rates again today by 25 basis points, Chair Jerome Powell reiterated that the central bank will adopt a data-dependent approach when it comes to weighing future rate hikes going forward. Major indexes, which had stumbled to their worst December start since the Great Depression1, were rallying this morning in anticipation of a more dovish outcome, but have since given up all of those gains and then some. The S&P 500® Index fell over 1.5% to 2,506, while the Dow Jones Industrial Average sank over 350 points to 23,323—both hitting new lows for the year.
In our view, the Fed threaded the needle today—raising rates and forecasting “some” further hikes, but marking down the anticipated number of rate increases for next year from three to two as concerns over the health of the global economy and financial markets have grown.
Today’s rate hike, the fourth of 2018, means that the Fed has now—somewhat boringly—taken tightening steps at every quarterly press conference meeting dating back to December 2016.
- First, he wants U.S. workers to have jobs. With the unemployment rate hovering around a 49-year low, Powell should feel pretty good about the full employment component of his dual mandate.
- Second, he wants to make sure the economy doesn’t overheat (translation: keep inflation stable at around 2%). The next batch of core personal consumption expenditures (PCE) inflation data will be released this Friday. Our expectation is that it will come in at 1.9% on a year-over-year basis. Admittedly, that’s a smidgeon below the central bank’s price stability target, but for all practical purposes, inflation is where the Fed wants it to be as well.
For a U.S. central banker, satisfying both of these mandates pretty much means mission accomplished. The Fed’s goal now becomes keeping the economy right here, forever (good luck!). How?
Establishing the neutral rate
Most policy rules will tell the Fed it should set its interest rate at a level that is neither restrictive nor accommodative for economic growth. Economists call this interest rate r-star, or the neutral rate of interest. The problem is that nobody knows where r-star is. The Fed has an informed guess about it—back in November, Powell said that rates are “just below the broad range of estimates of … neutral.” The Fed’s latest projections put this neutral interest rate at somewhere between 2.5% and 3% in nominal terms. We’d tend to agree. The current Fed funds target range of 2.25% to 2.5% is still slightly below neutral. As such, we think the next hike (probably in March) to get rates up into the neutral zone should be relatively easy. The decisions from there get a lot more interesting.
The Fed has transitioned its guidance on rates as we approach that point. In September, a large majority of FOMC participants advocated for a restrictive monetary policy setting (hiking beyond neutral). In November, the FOMC instead emphasized a flexible and data-dependent approach when considering further rate increases. Jerome Powell reinforced that tone in his press conference today. To be clear, data dependence does not mean dovish—it means that monetary policy decisions will be guided by data. In other words, if numbers from the first quarter of 2019 indicate a sharp slowdown in growth, the Fed is more likely to use this data as justification to hit pause on its interest-rate increases come June. On the flip side, if the data indicates a surge in inflation, the Fed may use that to justify the need for another rate hike.
U.S. growth and inflation outlook for 2019
Against this backdrop, the outlook for U.S. growth and inflation will prove pivotal for the Fed’s decisions in the new year. On the growth side of the ledger, incoming data continues to come in well ahead of the U.S. economy’s long-term potential (see first three rows in the table below). Put differently, there appears to be a significant cushion for a moderation in economic growth rates before the Fed should consider pausing. The slowing of global growth and the tightening of financial conditions are risks in this regard—but solely through their impact on domestic fundamentals. We believe that for now, the damage has not been severe enough to call into question the tightening cycle.
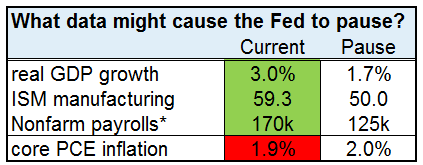
Source: Russell Investments, BLS, BEA, Institute for Supply Management. Data and estimates as of December 17th 2018. *Payrolls are shown as a 3-month average.
The inflation outlook is more uncertain. As noted above, our expectation is for core PCE inflation to log in at 1.9% for November—a tenth of a percentage point below the Fed’s target. We believe that a case can certainly be made for the Fed to wait for greater evidence that inflation is breaching its 2% inflation target before transitioning to a restrictive monetary policy setting.
Why? There are several cross-currents buffeting U.S. inflation.
On the downside:- Recent dollar strength is likely to prove disinflationary in early 2019 as it lowers the price of imported goods;
- The sharp decline in crude oil prices is a headwind;
- Perhaps most importantly, the U.S. housing market and rental price inflation show some early signs of slowing as higher mortgage rates have dented affordability for would-be new buyers.
- The labor market is historically tight;
- This is (finally) translating into accelerating wage inflation (see chart below);
- Producer prices are picking up; and
- Measures of output prices in the business surveys are generally inflecting higher as well.
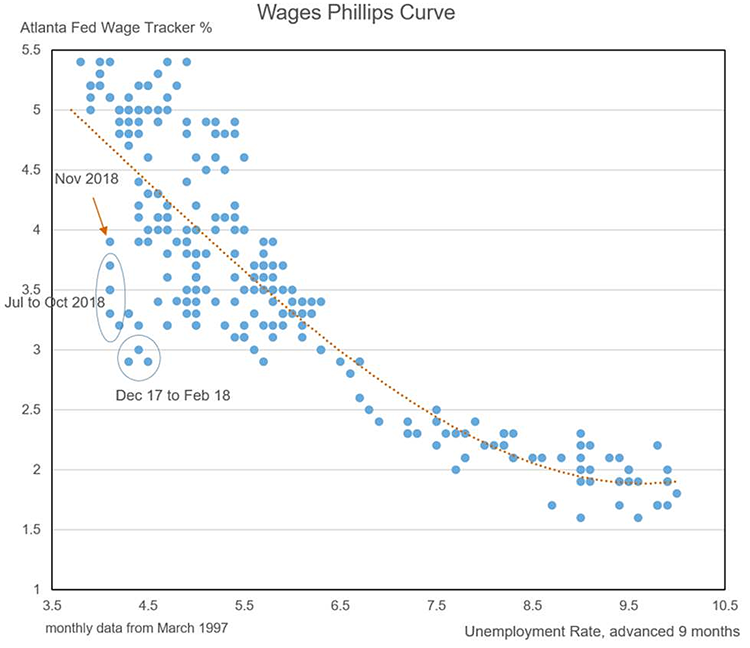
Source: Bureau of Labor Statistics, Federal Reserve Bank of Atlanta. Data as of November 2018.
While the verdict is not clear-cut, the balance of evidence in our view points to inflationary pressures gradually building as we get later in the U.S. cycle. Put differently, with growth comfortably above trend and with inflation creeping higher, the balance of evidence suggests the Fed will need to hike beyond March.
Key investment takeaways
From an investment strategy perspective, this is important because fed fund futures are now pricing less than one hike through the end of 2019. To reiterate our view: we think the next hike to get rates into the neutral zone will be relatively easy. And while we’d note the outlook from there is more uncertain, we see the balance of risks as being skewed to further hikes. The gap between our view on the likely path of Fed policy and what is priced into fixed-income markets is currently at its widest since August of 2017.
Cyclically, we see potential for higher 10-year U.S. Treasury yields over the next six months. From a sentiment perspective, investor positioning has also normalized. Speculators were overwhelmingly betting on rising rates three months ago. We find speculative positioning to be a powerful contrarian indicator. A few months ago, that indicator was advocating for us to express an overweight preference for U.S. Treasuries. It has now been neutralized. From a valuation perspective, 10-year Treasury yields have transitioned from being slightly cheap (3.25%) in November to now being within the vicinity of our 2.6% fair-value estimate.
Bottom line
Our cycle, valuation and sentiment framework suggests upside risk to Treasury yields over the next six months. Tactically, we see an opportunity to trim allocations to risk-avoiding fixed income and other rate-sensitive assets.
Disclosures
These views are subject to change at any time based upon market or other conditions and are current as of the date at the top of the page.
Investing involves risk and principal loss is possible.
Past performance does not guarantee future performance.
Forecasting represents predictions of market prices and/or volume patterns utilizing varying analytical data. It is not representative of a projection of the stock market, or of any specific investment.
This material is not an offer, solicitation or recommendation to purchase any security. Nothing contained in this material is intended to constitute legal, tax, securities or investment advice, nor an opinion regarding the appropriateness of any investment, nor a solicitation of any type.
The general information contained in this publication should not be acted upon without obtaining specific legal, tax and investment advice from a licensed professional. The information, analysis and opinions expressed herein are for general information only and are not intended to provide specific advice or recommendations for any individual entity.
Please remember that all investments carry some level of risk. Although steps can be taken to help reduce risk it cannot be completely removed. They do no not typically grow at an even rate of return and may experience negative growth. As with any type of portfolio structuring, attempting to reduce risk and increase return could, at certain times, unintentionally reduce returns.
Investments that are allocated across multiple types of securities may be exposed to a variety of risks based on the asset classes, investment styles, market sectors, and size of companies preferred by the investment managers. Investors should consider how the combined risks impact their total investment portfolio and understand that different risks can lead to varying financial consequences, including loss of principal. Please see a prospectus for further details.
Indexes are unmanaged and cannot be invested in directly.
The S&P 500®, or the Standard & Poor’s 500, is a stock market index based on the market capitalizations of 500 large companies having common stock listed on the NYSE or NASDAQ.
The Dow Jones Industrial Average (DJIA) is a stock market index of 30 large U.S. companies created by Dow Jones & Company co-founder Charles Dow. First calculated in 1896, the DJIA is currently owned by S&P Dow Jones Indices, which is majority owned by S&P Global.
Russell Investments' ownership is composed of a majority stake held by funds managed by TA Associates with minority stakes held by funds managed by Reverence Capital Partners and Russell Investments' management.
Frank Russell Company is the owner of the Russell trademarks contained in this material and all trademark rights related to the Russell trademarks, which the members of the Russell Investments group of companies are permitted to use under license from Frank Russell Company. The members of the Russell Investments group of companies are not affiliated in any manner with Frank Russell Company or any entity operating under the "FTSE RUSSELL" brand.
Copyright © Russell Investments Group LLC 2018. All rights reserved.
This material is proprietary and may not be reproduced, transferred, or distributed in any form without prior written permission from Russell Investments. It is delivered on an “as is” basis without warranty.