It’s the economy: Key themes from the Economic Indicators Dashboard – November 2022 edition
- The resilience of the labor market means the U.S. is probably not in a true recession
- Macroeconomic headwinds do, however, make a mild recession within the next 12 months more likely than not
The bottom line: Many investors have seen first-hand how difficult 2022 has been, but it can be useful to drill into specific economic and market indicators to better understand what is happening.
Introduction
2022 has been a challenging year for investors, with both U.S. bonds and equities down double digits year-to-date. Amid the difficult market environment, it’s more important than ever to keep abreast of macroeconomic developments. While our team at Russell Investments monitors a broad array of macroeconomic and market indicators, we believe that our Economic Indicators Dashboard provides a pithy summary of some of the key indicators that investors are likely to hear being discussed in the news. In this report, we’ll unpack three key takeaways from the Economic Indicators Dashboard.
Click image to enlarge
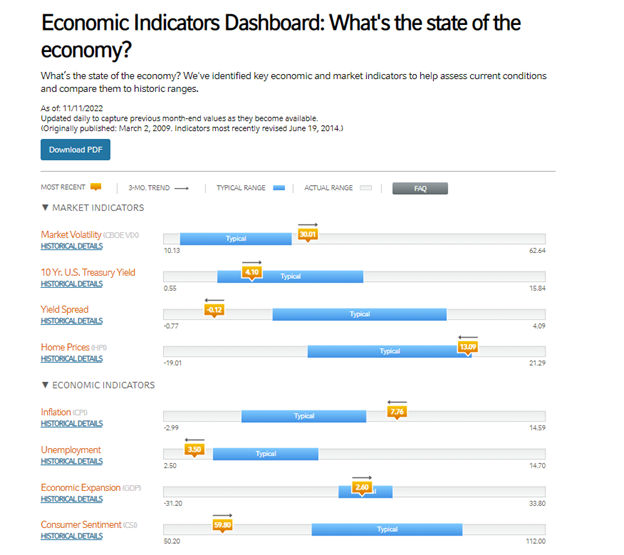
Source: Russell Investments
Theme 1: We are probably not yet in a recession
Although politicians and pundits might try to characterize the current economic period as being a recession, we do not believe that a recession has arrived yet in the U.S. While it’s true that we had two consecutive quarters of negative GDP (gross domestic product) growth in the first half of 2022, that by itself is not sufficient for a true recession to be declared. In the U.S., an advisory group called the National Bureau of Economic Research (NBER) is responsible for identifying recessions.
If you want to know why the NBER might be hesitating about labelling the current economic environment as recessionary, just take a look at the labor market. The unemployment rate in the U.S. has been hovering between 3.5% and 3.7% recently, which is among the lowest unemployment rates in history.
Click image to enlarge
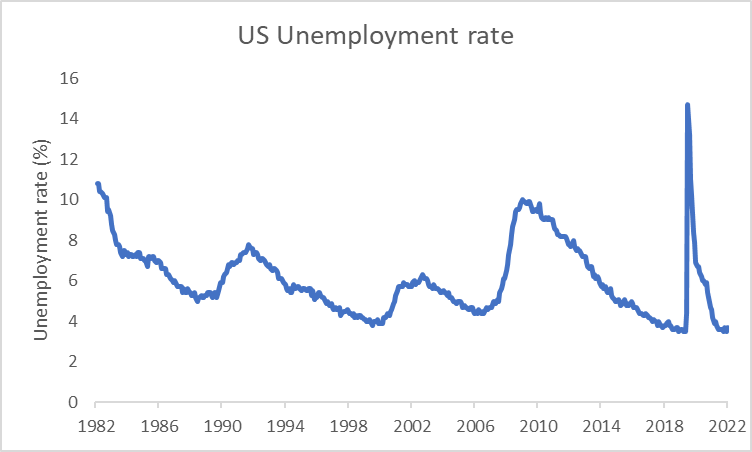
Source: Refinitiv Datastream
Even in a healthy and strong economy, the unemployment rate is still typically greater than zero. There is a baseline level of unemployment that will occur due to structural reasons. We call this level of unemployment the Natural Rate of Unemployment. While the exact level of the Natural Rate of Unemployment is uncertain and must be estimated, the Federal Reserve (Fed)’s midpoint estimate of the Natural Rate of Unemployment is 4%—above the current unemployment rate. With the Natural Rate of Unemployment above the current unemployment rate, this means that our economy is still above full employment. This suggests that despite all the headwinds in 2022, the labor market is still quite resilient. And resilient labor markets are not a typical hallmark of a recession.
In addition, the negative GDP growth appears to have been short-lived. The US Bureau of Economic Analysis’ advance GDP estimate showed that GDP growth returned to positive territory in the third quarter of 2022, with the economy growing at an annualized 2.6% rate.
Theme 2: But a mild recession might be in store in the next 12 months
So now that we’ve shared the good news, it’s time to share the more disappointing news. Although a U.S. recession is still not inevitable, we now believe that a mild recession in the U.S. in the next 12 months is now the most likely scenario.
Consumers have been feeling the pinch this year. Even though the October CPI print was softer than expected, inflation still remains a significant challenge. With headline CPI (consumer price index) inflation rates still hovering at around 7.8% year-over-year, consumers have seen their real (inflation-adjusted) wage growth slip into negative territory. Given the weakness in real wages, consumers may try to borrow money to fund their spending. And it’s true that consumer balance sheets are still somewhat healthy for now, giving consumers some flexibility to borrow more. But we know that there’s a limit to what consumers can borrow, and eventually, the weakness in consumers’ real wages will likely force them to reduce their spending, hurting the engine of economic growth.
In addition to the headwinds from poor wage growth, low consumer sentiment can also create a drag on consumption. The University of Michigan consumer sentiment measure stood just shy of 60 in October (59.8 preliminary, 59.9 final). Although consumer sentiment has rebounded from earlier in the year, it nevertheless remains relatively low. Anxiety over a potential economic slowdown as well as the sting from inflation have contributed to the depressed consumer mood.
Click image to enlarge
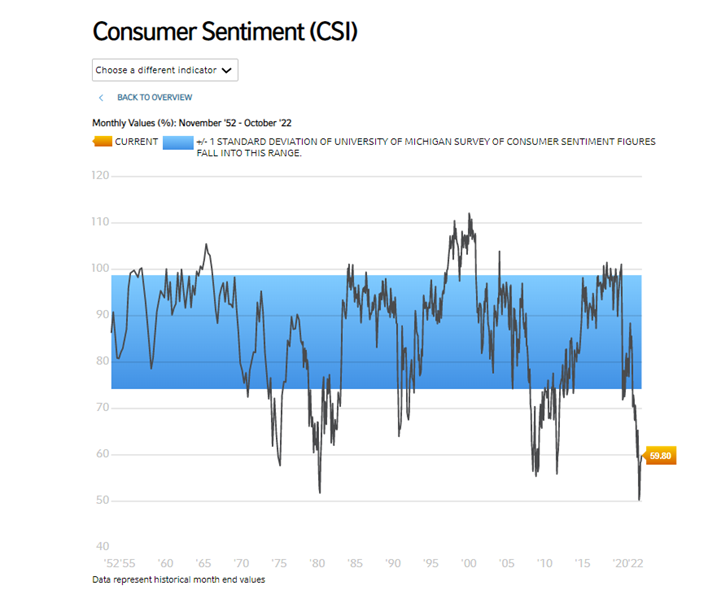
Source: Russell Investments’ Economic Indicators Dashboard using underlying data from University of Michigan
If the consumer mood continues to become bleaker, it could lead to consumers pulling back their spending in the future, which would be detrimental to economic growth.
In some ways, we are already seeing consumer spending being impacted. According to the Bureau of Economic Analysis, personal consumption expenditures contributed just under one percentage point to annualized GDP growth in the third quarter of 2022. That’s far short of the 2.27 percentage points that personal consumption expenditures contributed to annualized GDP growth in the third quarter of 2019—before the COVID pandemic roiled the world.
Moreover, purchasing manager index (PMI) values have already fallen into contractionary territory. The PMI data is a key leading indicator and suggests likely softening of the economy to come. With the passage of time, the softening economic data will likely eventually show up in lagging indicators like the unemployment rate, too.
Finally, financial markets have already started to price in some level of recession risk. Some of the popular yield curve measures (10-year minus 2-year spread, 10-year minus 3-month spread) are inverted, signaling that markets anticipate interest rates will likely fall at some point, notwithstanding the current hawkish Fed. Falling interest rates generally coincide with recessionary periods, as the Federal Reserve will likely need to cut interest rates during recessions to provide support to the economy.
For these reasons, we think that a recession within the next 12 months is more likely than not as the Federal Reserve continues to tighten its monetary policy stance. But the combination of relatively low consumer debt service ratios, along with stringent loan underwriting standards, should help limit the depth of any potential recession.
Theme # 3: A volatile and uncertain year
Given all the macroeconomic challenges, it should not be a surprise that 2022 has been riddled with bouts of market volatility. At the start of November, for instance, we saw the S&P 500 Index rally by about 1% in the immediate aftermath of the Fed statement release. But when the press conference wrapped up and markets closed, the S&P 500 ended the day down more than 2%.
Large intraday swings have been prevalent throughout 2022. Year-to-date through early November 2022, the S&P 500 has seen an average intraday volatility of approximately 1.9%—significantly higher than the average intraday volatility across all years of 1.3%.
Click image to enlarge
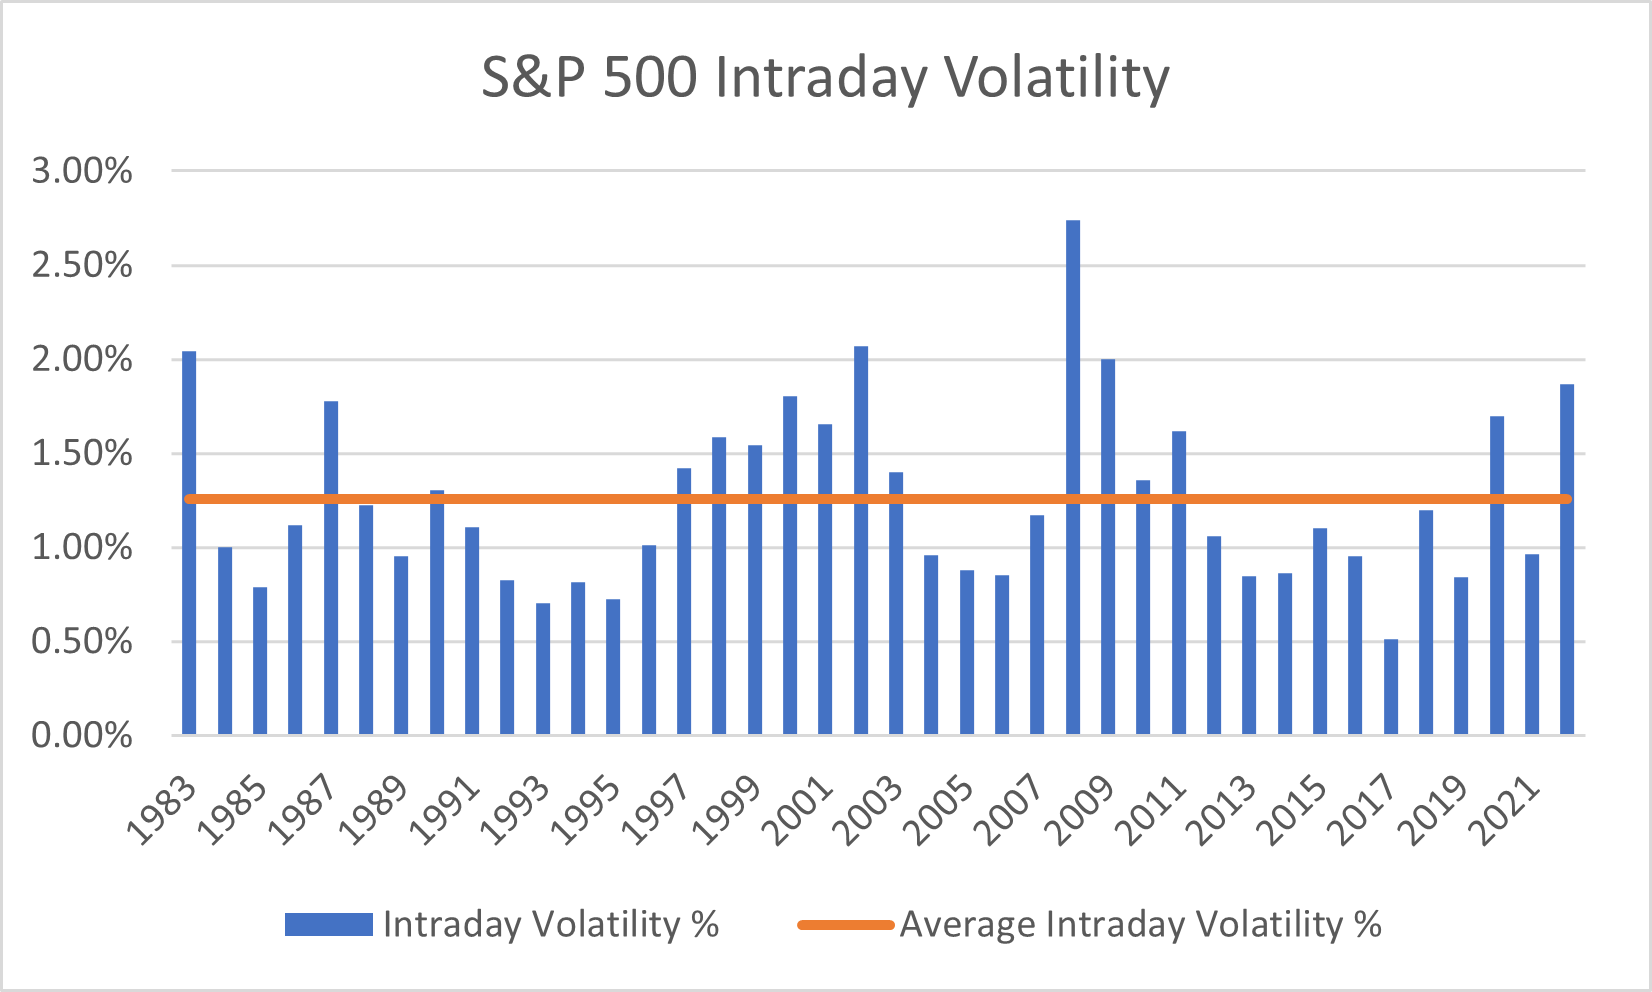
Source: Refinitiv Datastream. Intraday Volatility % is measured as the difference between the high and the low price on the S&P 500 index on any given trading day, divided by the previous day’s closing price. The Intraday Volatility % for a given year is calculated as the average of the daily intraday volatility % observations for that year. The Average Intraday Volatility % (orange line) is calculated as the average of the Intraday Volatility % for each year from 1983 through 2022.
Against this backdrop, investors may wonder why the VIX measure on the Economic Indicators Dashboard appears only slightly above the typical range. The VIX is not a measure of actual market volatility, but rather a mathematically derived formula of implied volatility based on option pricing. Implied and actual measures of market volatility do not always align one-to-one.
Another contributing factor is that the VIX itself can be volatile, with readings fluctuating noticeably from day to day. In fact, the VIX was just less than 24 as of Nov. 14, 2022 compared to the 30.81 reading we saw in late October.
To help put things into better perspective, let’s take a look at how many days in each year the VIX has spiked above 30. As you can see from the chart below, the VIX typically has an above-30 reading for around 22-23 trading days each year. And in some years, the VIX never spikes above 30 at all. But in 2022, we’ve already seen the VIX cross above that 30 threshold nearly 50 days this year, and the year still hasn’t finished yet. So it’s fair to say that 2022 has been a noticeably volatile year.
Click image to enlarge
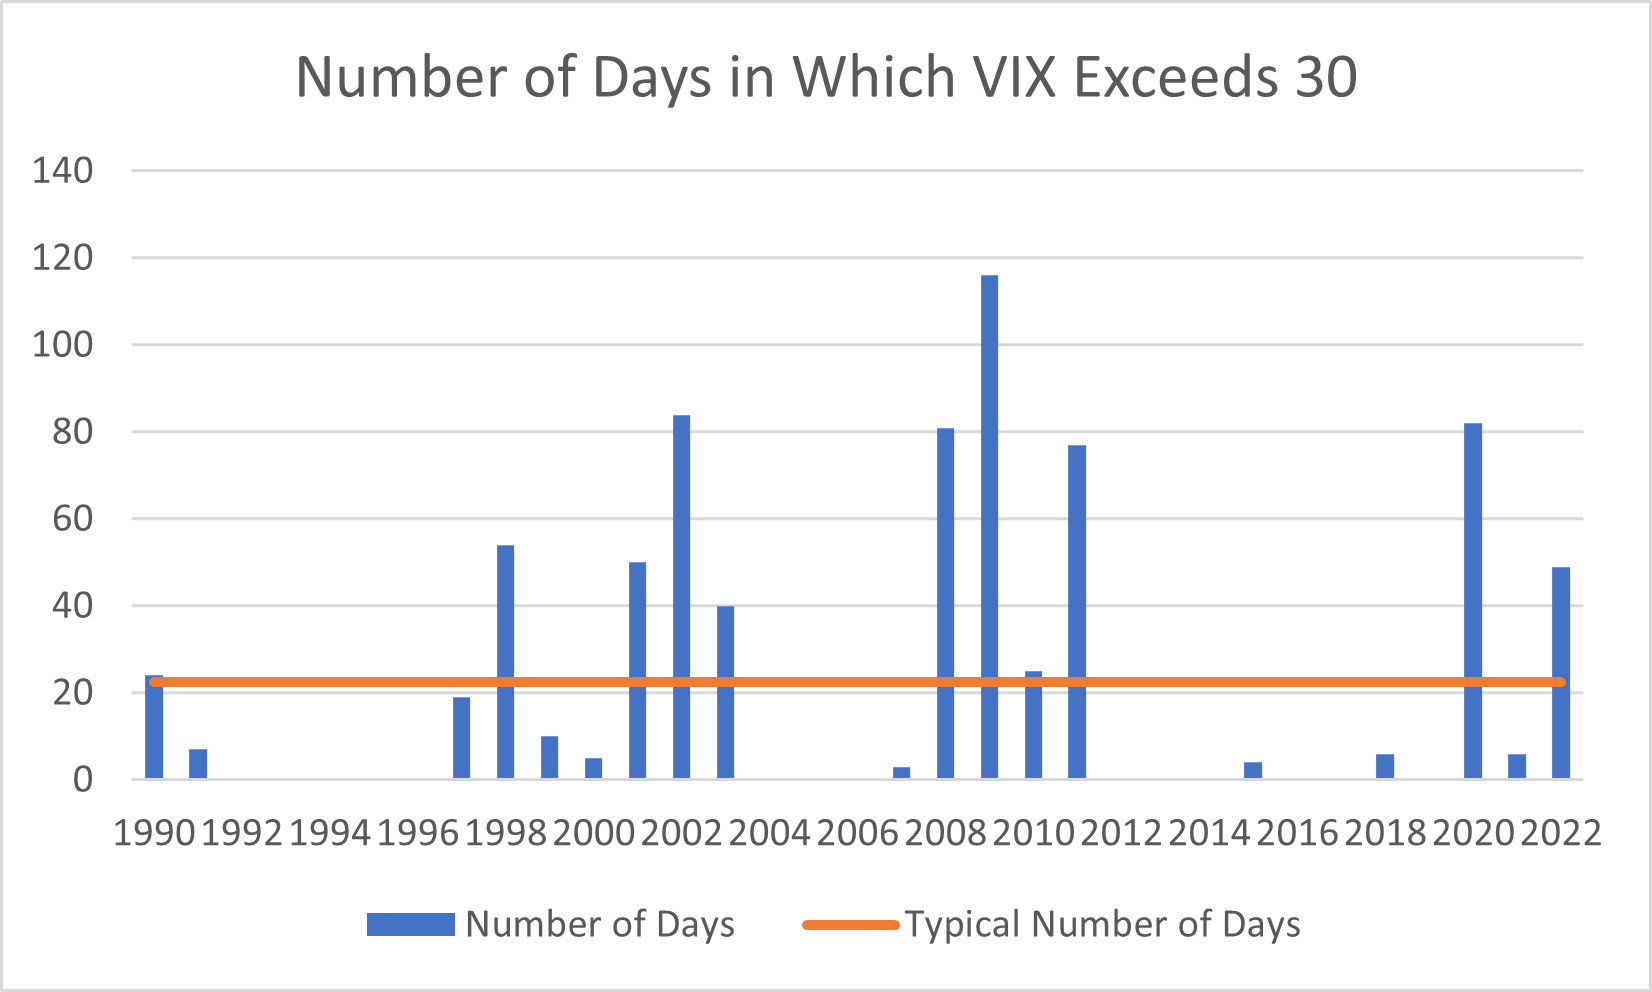
Source: Refinitiv Datastream
The market volatility has been one of the contributing factors to investor pessimism. Our Composite Contrarian Indicator, which tracks investor sentiment, is still showing that investors are somewhat nervous, even as the indicator has pulled back from the panicked extremes we saw earlier in the year.
Click image to enlarge

Source: Russell Investments’ proprietary indicator which considers a mix of technical, positioning, and survey-based measures of investor sentiment. Data as of Nov 14, 2022.
Overall, 2022 has been a challenging and newsworthy year. As the year comes to an end, investors should think about what the future may bring. Stay tuned for our Global Market Outlook in which we preview expected trends in 2023.